


A tool created by Kosuke Imai (left), a professor of statistics and government, and Ph.D candidate Corey McCartan has been used by plaintiffs in gerrymandering cases in Alabama, New York, Ohio, and South Carolina.
Kris Snibbe/Harvard Staff Photographer
Science & Tech
How to spot a gerrymandered district? Compare it to fair ones.
Harvard team’s tool maps out thousands of nonpartisan options, simulates outcomes, holds up results to those of proposed plans
New waves of statisticians, including a team at Harvard, have developed tools they think can help police the longstanding problem of gerrymandering of congressional and legislative districts in states by parties seeking to tip the scales for their candidates.
Gerrymandering has been part of American politics since the 1800s, with results that are at the very least controversial and sometimes illegal, particularly if it’s done to dilute the voting power of communities of color. The battle is renewed every decade in state legislatures when Census figures show which districts need to be rebalanced owing to population shifts. Sometimes violations appear blatant but often they are more subtle, and in either case they can be difficult to prove.
By harnessing the quantitative power of big data computing, these statisticians have developed algorithms that can identify likely gerrymandered maps by putting redrawn districts through hundreds, even thousands of computational tests and simulations. These tools — developed over the past decade often through open sourcing — provide powerful evidence of whether a plan falls outside the norm of a “fair” plan. The tests recently have been gaining traction and increasingly are being used as evidence of illegitimacy in court.
One method started at Harvard in 2020 has been quickly making an impact. It’s been used by researchers, journalists, and election analysts, and has played significant roles in recent legal cases where legislators were forced to throw out gerrymandered maps.
Called “redist,” the tool creates a vast pool of alternate nonpartisan plans (upwards of 5,000 to 10,000) that can be compared to a map that’s being proposed or has already been enacted by local legislators or redistricting committees. This pool of nonpartisan baseline maps makes it possible to see whether the new map fairly represents the new shifts shown in the Census, or is an outlier.
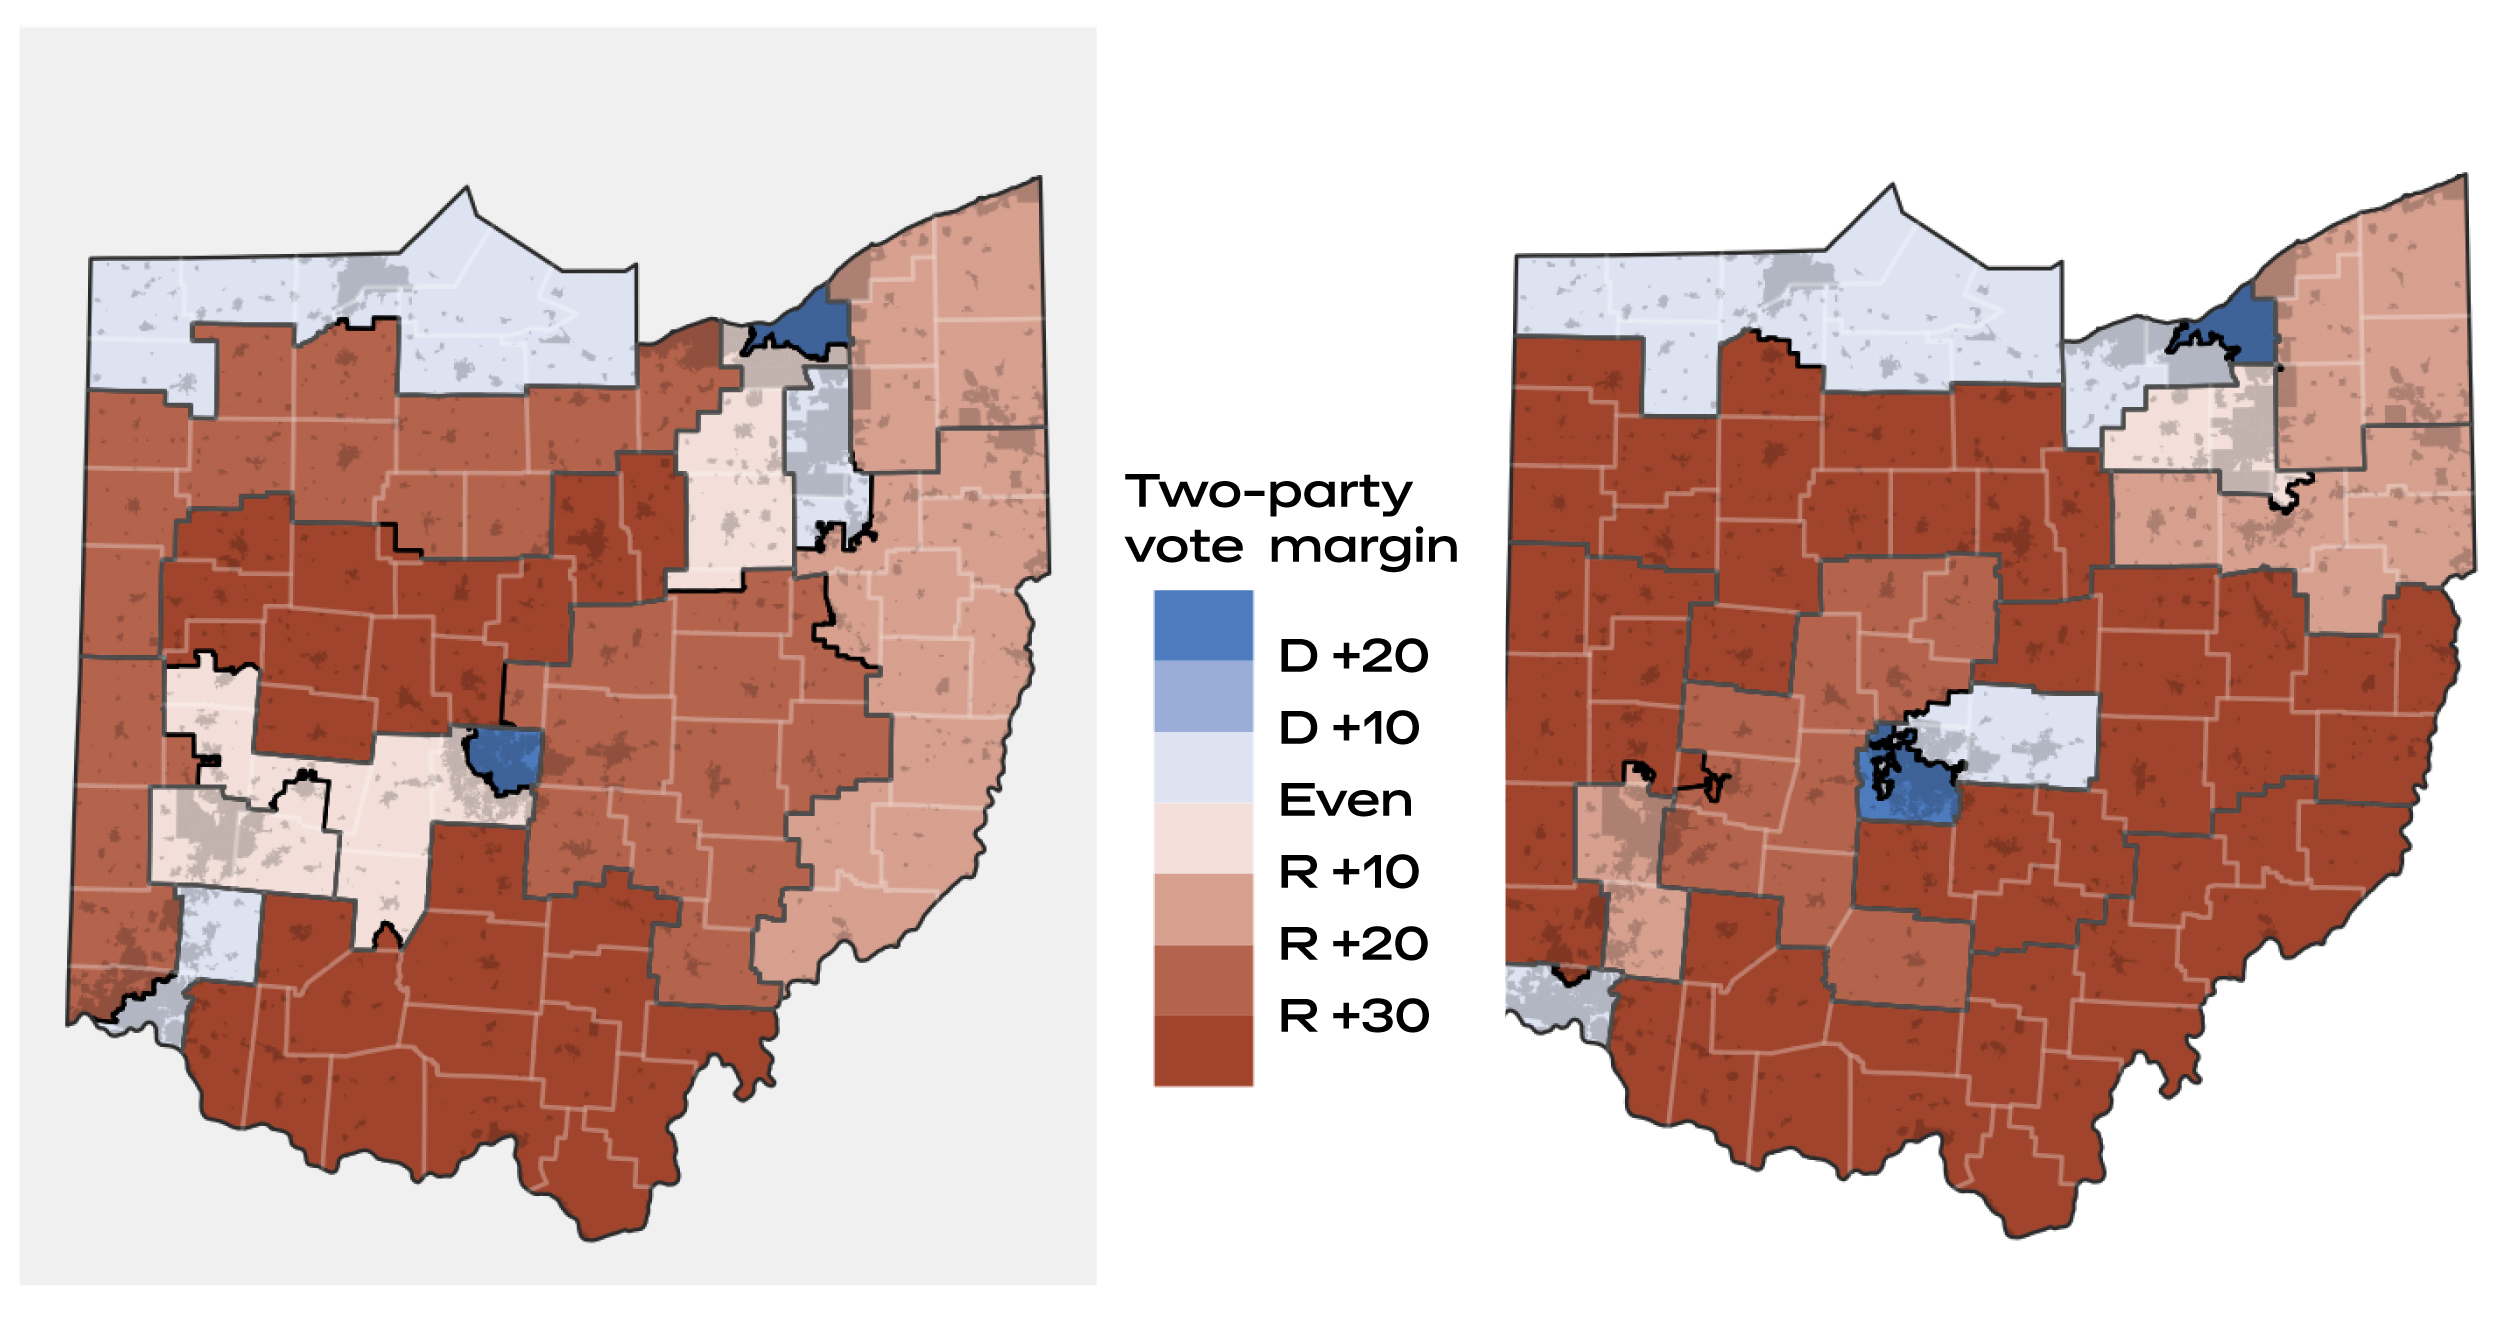
Ohio’s districting map (shaded box, left) alongside one of 5,000 alternative maps the researchers simulated.
Algorithm-Assisted Redistricting Methodology Project
“What the algorithm does is that using the geography and distribution of different voters within the state, it shows what kind of partisan outcome we should expect,” said Kosuke Imai, a professor in the departments of statistics and government. “But if we see something very different in comparison to this nonpartisan baseline, favoring one party under the enacted plan, that’s evidence that there are some other factors influencing when the plan was drawn.”
For example, researchers say, consider a case in which the tool runs 5,000 simulations and finds that on average the legislative minority party should be winning about five to seven seats. But simulations using a map pushed through by the majority party has its rival winning only two seats. This signifies a rare or almost impossible occurrence and supports the likelihood of partisan gerrymandering, the researchers said.
Imai developed redist with Cory McCartan, a Ph.D candidate at the Graduate School of Arts and Sciences focusing on statistics. The pair found traditional methods for evaluating the fairness of redistricting plans weren’t working well, because they didn’t provide a neutral baseline to make objective comparisons. Fairness often became a subjective call, they said.
“For a long time, people have done gerrymandering and the question is ‘OK, how do I prove it?’” McCartan said. “It’s one thing to say, ‘Hey, I think that map looks unfair because the boundaries are super squiggly.’ But these things get litigated in court, so a judge has to clearly be able to decide: Is this fair or not?”
The redist software uses what’s called the sequential Monte Carlo (SMC) algorithm to run its simulations. The software starts with a blank map, then draws one district map at a time, then does it again and again. Each alternative map is drawn in parallel and incorporates that state’s population, demographic data, and districting laws. Once these alternative maps are drawn, the redist software uses visualization tools to help users understand the data with charts and graphs summarizing the simulations.
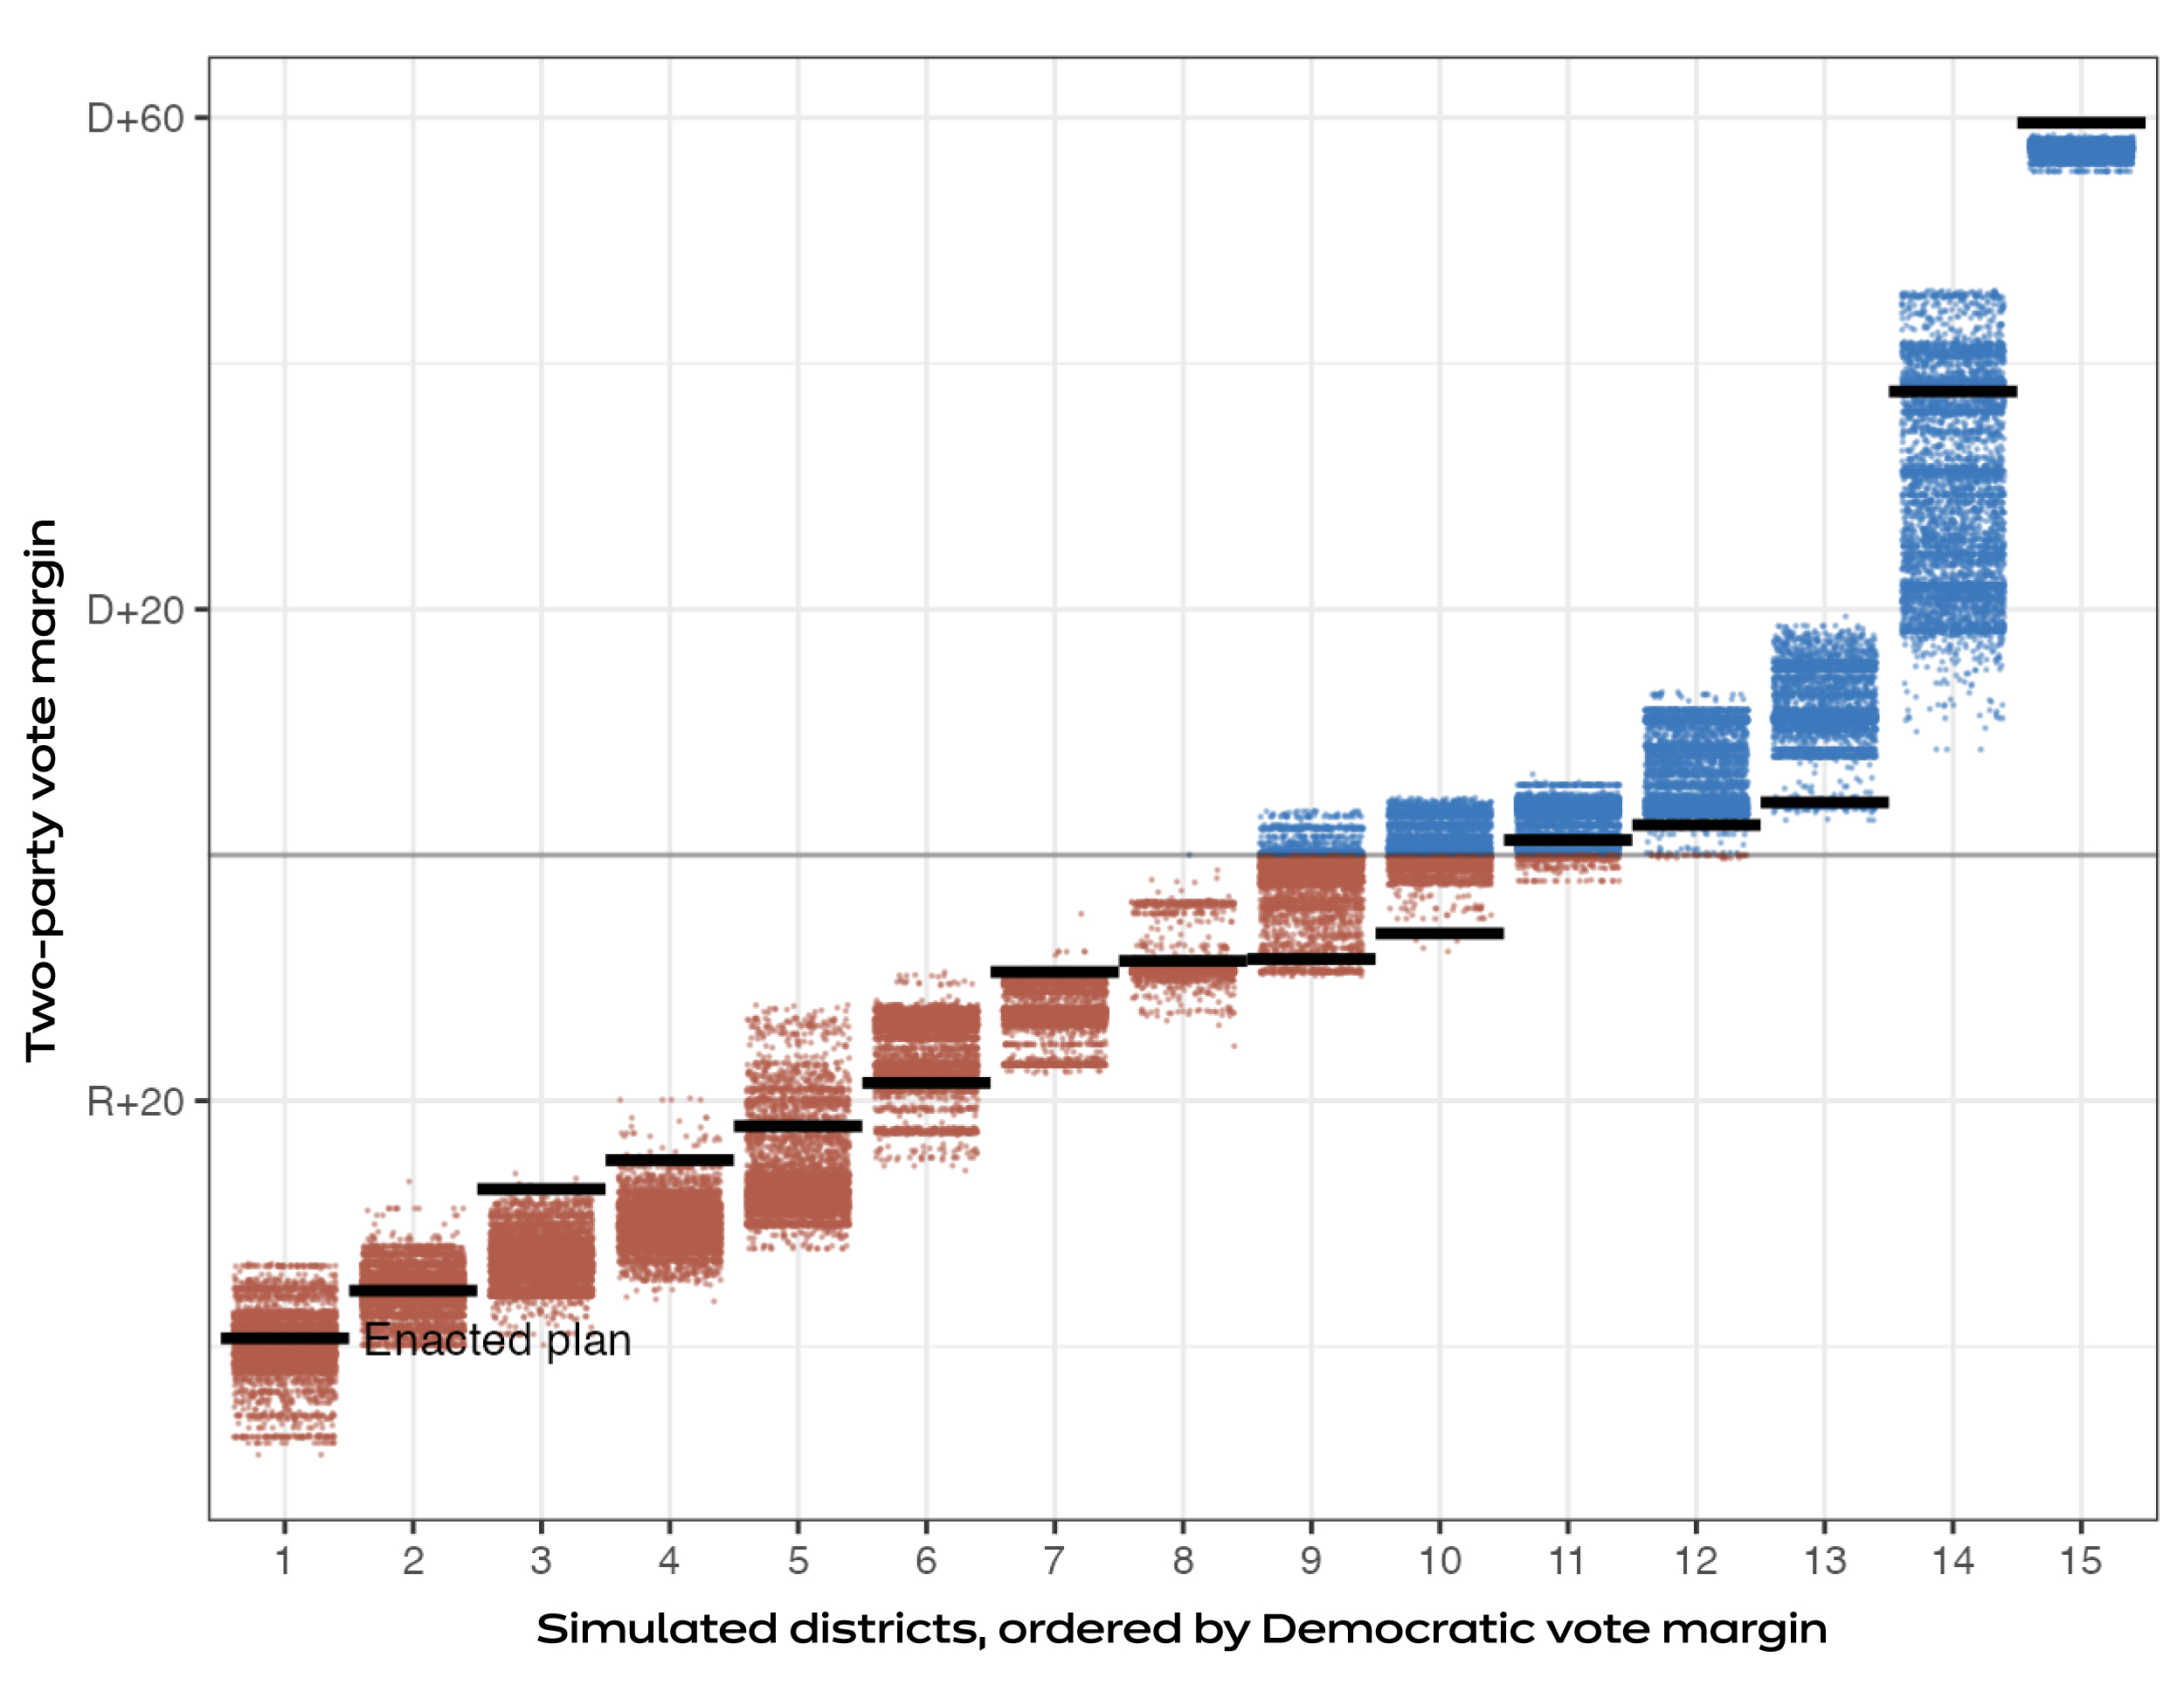
Graph looks at how each district of Ohio’s enacted plan compares to the set of simulated districts.
Algorithm-Assisted Redistricting Methodology Project
Unlike most similar algorithms, the SMC algorithm doesn’t start from a single map and keep altering that one. Instead, the algorithm starts with a blank map and generates new alternative plans from new blank canvases. This random generation enables the algorithm to efficiently explore more unique alternatives and generate a representative sample of plans. Existing algorithms that don’t do this run the risk of exploring plans that are very similar to the starting map, which may already have a partisan bias, the researchers said.
“Say the enacted plan is favoring Democrats,” Imai said. “If an algorithm only explores very similar plans [because it starts with this enacted plan], then maybe all the simulated plans based on it also favor Democrats. When this happens, that enacted plan doesn’t look like a gerrymander.”
Redist has been used by plaintiffs in gerrymandering cases, including actions in Alabama, New York, Ohio, and South Carolina. In New York, an elections analyst used the SMC algorithm to produce 10,000 maps to help show the map drawn by New York state’s Democratic legislature was an “‘extreme outlier’ that likely reduced the number of Republican congressional seats from eight to four.” A state Appeals Court ordered the map be redrawn.
In Ohio, Imai was called as an expert witness for plaintiffs accusing the Republican-controlled redistricting commission of gerrymandering. The SMC algorithm generated 5,000 maps for the case, none of which was as favorable to Republicans as the commission’s proposal. The state Supreme Court ordered that body to revise.
The algorithm is also being used in a case brought before the U.S. Supreme Court involving allegations of racial gerrymandering in Alabama. Imai served as an expert witness for the plaintiffs, arguing that its new congressional map intentionally dilutes the Black vote. The case, which relies on protections in the Voting Rights Act, could eliminate one of the few remaining nationwide safeguards against rigged legislative maps.
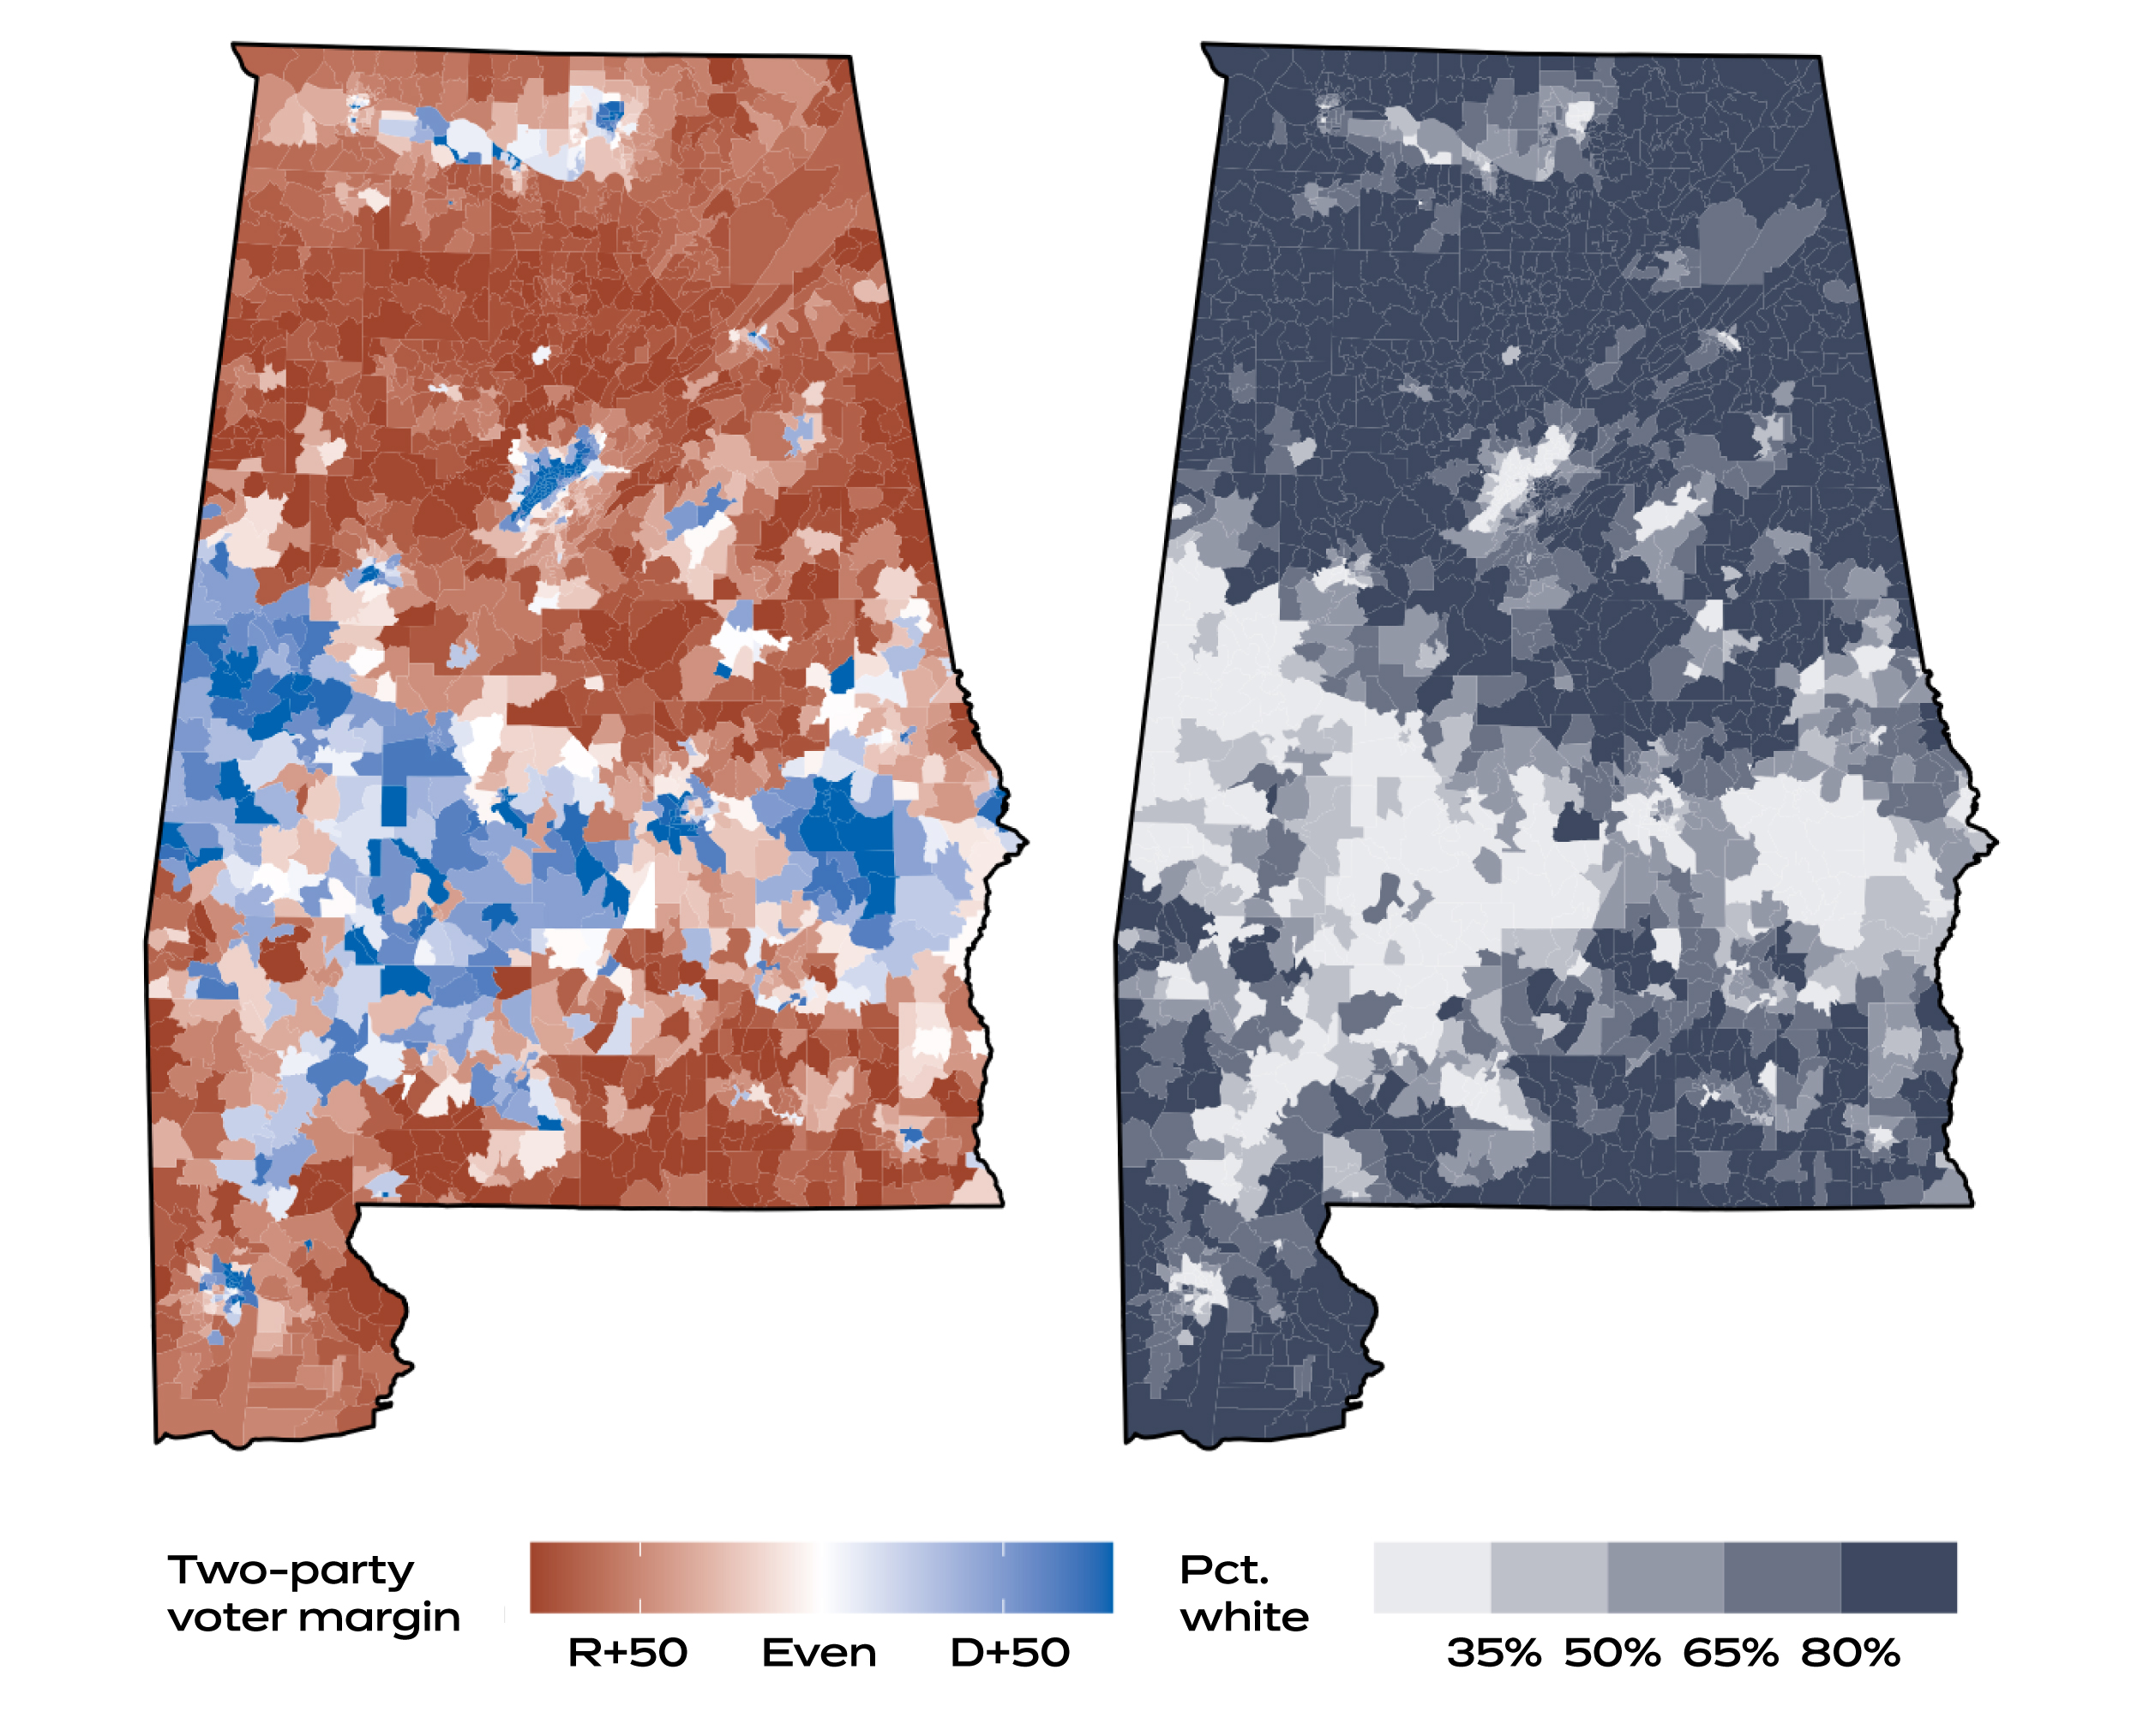
Maps show partisan lean across Alabama in a typical statewide election, and the share of minority voters around the state.
Algorithm-Assisted Redistricting Methodology Project


Redist has become a major focus in Imai’s research group at Harvard called the Algorithm-Assisted Redistricting Methodology (ALARM) Project. The group recently launched the 50-State Redistricting Simulation Project and is using the software to evaluate the redistricting plans across the country by producing 5,000 alternative maps for each state.
The easy-to-use tool lets users select a state and explore the maps. To make the data more accessible and digestible, ALARM provides a breakdown of how many congressional districts exist in that state, its redistricting requirements, its political geography, and a summary of what the computer found, including graphs and tables.
All the data can be downloaded. The source code is provided so it can be used as a template to generate simulated plans under different specifications.
The ALARM group members — who includes undergraduates, graduate students, and even high school students — say the process is rigorous since each state has different rules that need to be translated into the algorithm, and they need to run diagnostics to make sure everything goes smoothly.
Still, they believe the effort is worth it.
Up next for the ALARM Project is a plan to explore expanding redist from looking at the partisan bias of gerrymandering to racial gerrymandering, and to evaluate gerrymandering at more local levels.
“There’s always a question of how different ways of drawing boundaries can benefit some voters and harm others,” Imai said. “It’s important for social scientists to understand the nature of these types of political manipulations and address it.”