


Work & Economy
New interactive website helps chart paths for economic growth
Kennedy School’s Growth Lab tool to aid planners in identifying economic growth strategies
Let’s say you are a government official weighing economic development strategies. Or you’re an entrepreneur looking for the best place to manufacture your new high-tech device. How do you sort through the mountains of available data to figure out which countries have the know-how to achieve dynamic growth — and which do not?
Researchers at Harvard have built a powerful new tool that will do a lot of the work for you.
The Growth Lab, a program of the Center for International Development (CID) at Harvard Kennedy School, has just launched its Country Profiles portal, an interactive website that boils down 6,000 data points into a handful of interactive graphs. The algorithms built into the program generate suggested growth strategies and identify economic opportunities for each of the 130 profiled countries.
For more than 10 years, CID’s Growth Lab team has been building its Atlas of Economic Complexity, a sophisticated research and data visualization tool that allows the user to examine an almost endless array of exports, industries, technologies, and capabilities in countries across the world. In fact, the mountains of data risked overwhelming users. So the Growth Lab team set out to harness and automate the data in simpler, more user-friendly forms that look not just at current national performance but at future strategic paths: how an existing garment sector manned by skilled workers, for example, could be a foundation for a high-tech fabrics industry.
The result is the Country Profiles website, launched at a Kennedy School event on Sept. 18. The site assesses a country’s economic structure, its market dynamics, its product strategy options, and its growth opportunities. Users — be they policymakers, scholars, private investors — can compare one country to another as they evaluate national outlooks and obstacles.
Ricardo Hausmann, the Rafik Hariri Professor of the Practice of International Development and faculty director of the Growth Lab, compared the original Atlas of Complexity with the new Country Profiles tool: “We are moving from saying ‘let’s look at GDP’ to ‘let’s look at economic structure, at how countries are moving and evolving,’ so people can interact with these phenomena with a level of granularity. It’s a bit like looking up at the stars versus looking with a telescope. This is a way of looking at countries with high definition.”
The original Atlas and the new Country Profiles both are grounded in measurements of a country’s economic complexity. That’s a gauge of how adaptable nations can be to adopt new technologies and respond to the demands of evolving markets, based on the diversity and sophistication of what its labor force knows how to produce. Thus nations like Hausmann’s native Venezuela or Algeria rank low in complexity because they rely on natural resource exports (mainly oil and gas) compared with countries like the Czech Republic and Singapore that have achieved far greater economic diversity.
A strength of the Country Profiles tool is its ability to build custom data visualizations from 50 years of global trade flows — and then figure out what products and trade strategies will enable specific countries to grow. There are options for nations to go for “low-hanging fruit” or to seek balanced growth — or to make higher-risk bets that could generate faster growth in challenging export markets.
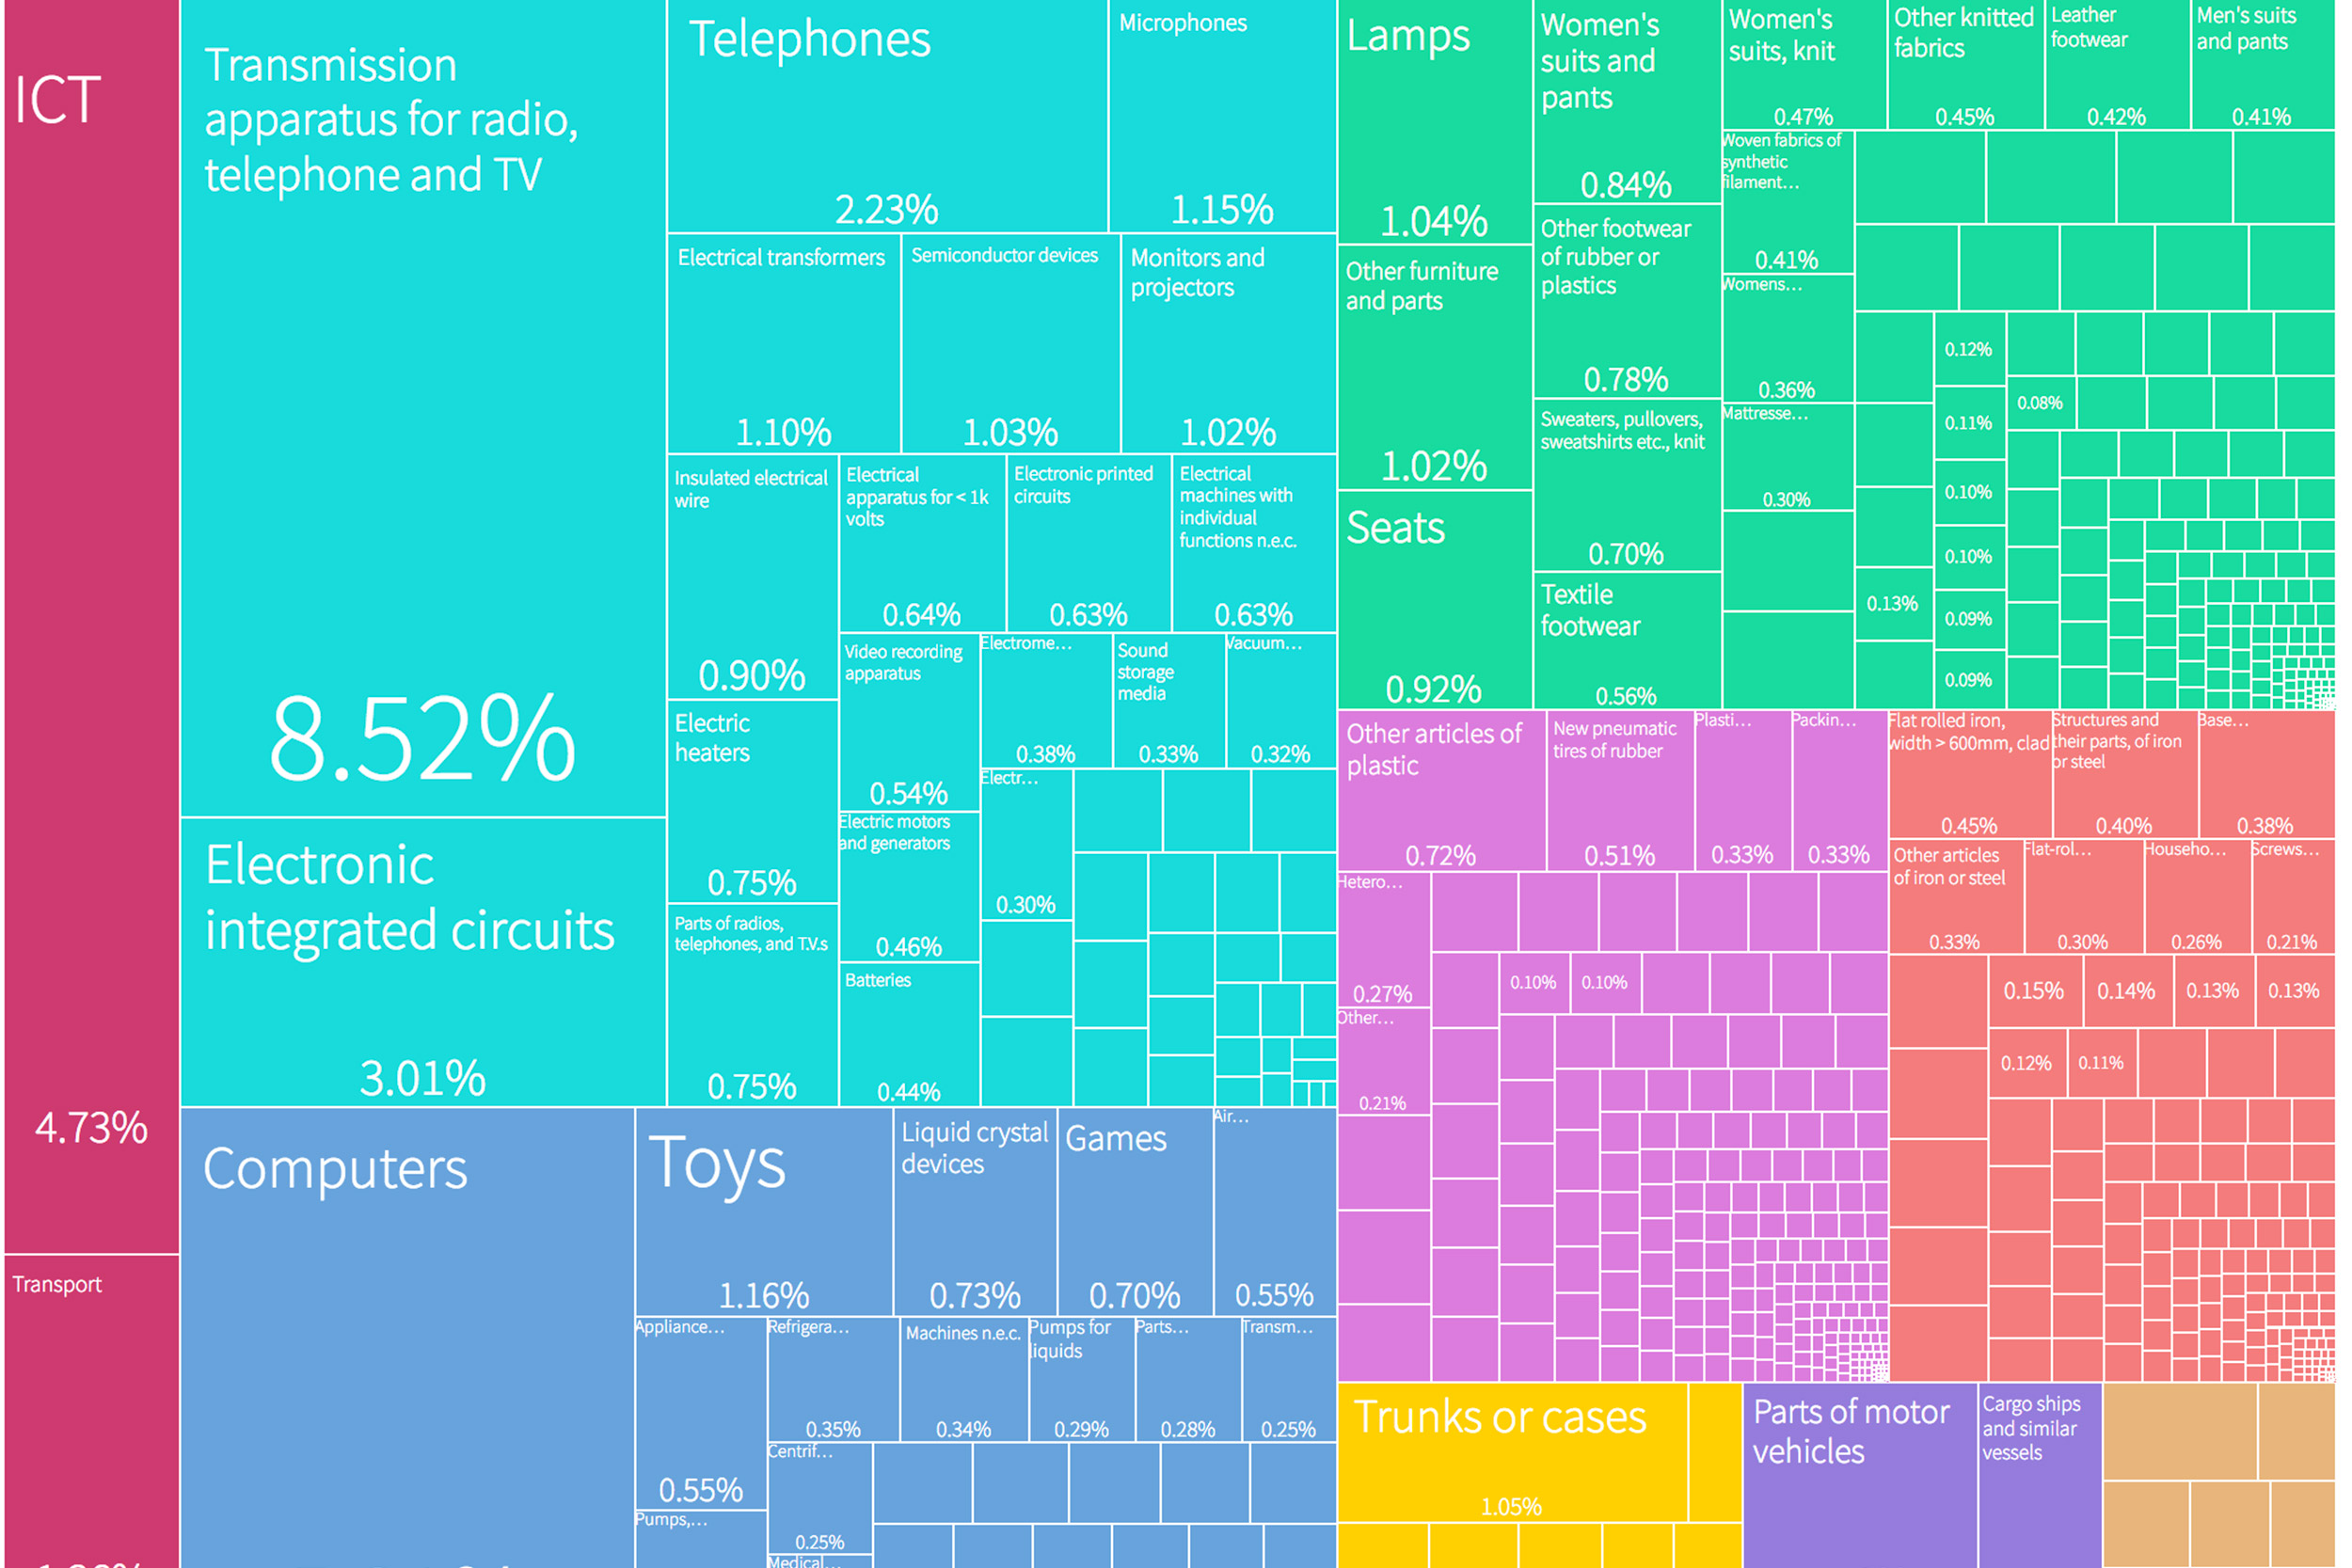
Tim Cheston, M.P.A./I.D. ’14, a senior manager for applied research at the Growth Lab, took the launch event audience through one country profile: China. Cheston showed how the data revealed that China’s economic growth, from textiles to electronics and machinery, is anything but random. China is the 19th most complex country in the world even though it is just the 55th richest, in per capita rankings.
“If diversification is the key to growth, we see all the products China has added — 54 new products,” Cheston said. “This has earned China an A+ in our algorithm. It explains China’s record growth — and predicts rapid future growth. But China is a rarity.”
The Country Profiles tool allows users to select one of three levels of strategic risk for a country, which generates a portfolio of 50 high-value industries and their potential economic impact. This insight into the “strategy space” lets policymakers decide whether to pursue “long jumps” into exports that offer greater prospects of major growth or to stick with safer market options. For instance, whether Ethiopia should play it safe in moving further into garments to build on an existing base, or to make a strategic bet on wholly new sectors in plastics or electronics.
All of this is distilled into 10 interactive graphs that users can tweak to tell revealing strategic stories about the 130 countries currently in the database. Annie White, senior product manager at the Growth Lab, showed how the tool categorizes a country’s economic growth pattern – either promising, moderate, static, or troubling — depending on the complexity of its main exports. These ratings are computer-generated based on each country’s database. She said each country profile contains 100 instances of computer-generated language.
Hausmann said the Growth Lab and the Country Profiles are built on a premise he developed in the early 2000s with Dani Rodrik, the Ford Foundation Professor of International Economy: “that countries don’t grow by making more of the same; they grow by changing what they make.”
The Atlas of Economic Complexity is approaching 1 million users in its 10 years exploring the trade patterns of 6,000 products across every country in the world. The streamlined, interactive Country Profiles tool makes it much easier for practitioners and policymakers alike to study where a country is coming from, Hausmann said, “but the most exciting thing is learning where it may be going.”