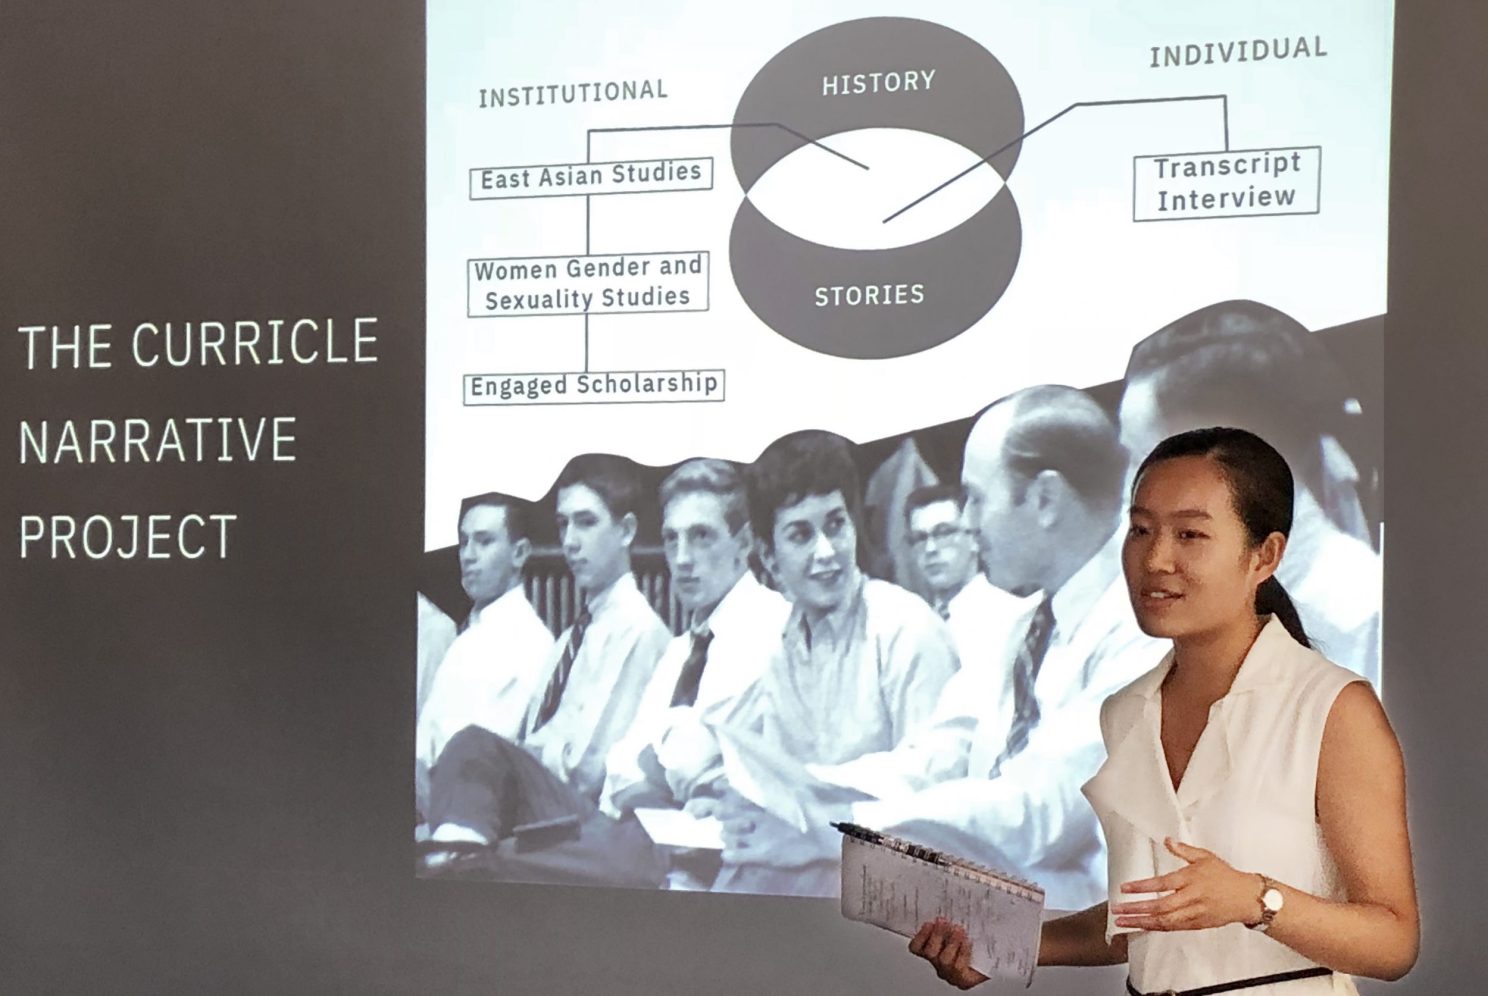
Harvard senior and metaLAB summer SHARP Fellow Snow Dong explains how she used Curricle to research the history of Harvard’s East Asian Studies Department. Photo by Randy Rosenthal
About three years ago, metaLAB at Harvard took up the challenge to develop a digital tool that would revolutionize how students, faculty, and administrators engage with the Harvard curriculum.
On Thursday, Aug. 2, 2018, in front of a small audience of deans, faculty, and members of Harvard Initiative for Teaching and Learning (HILT), the LAB presented the soft launch of Curricle, a platform that visualizes the course catalog and the history of Harvard’s curriculum through the use of algorithms and machine learning. Curricle is still a work in progress, but a fully working beta version will be live later in August, ready to be tested during the fall semester.
Jeffrey Schnapp, faculty director of metaLAB, began the presentation by talking about Curricle’s history and ambitions. When looking at the history of the course catalog, he said, from pamphlets to the printed book that dominated for 80 years to the online version currently in use, the basic way courses are described hasn’t really changed. A course has always been treated as “an atom placed in a list.” But “a curriculum is a living, pulsing thing made out of relationships,” Schnapp said, and this is what Curricle aims to capture.
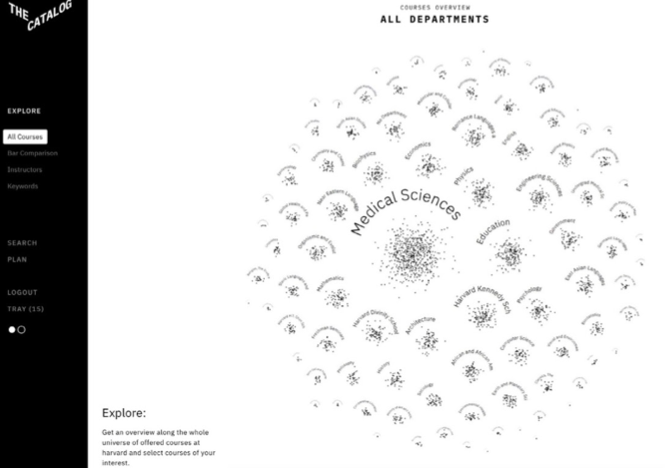
One way the program does this is by visualizing curriculum “over the sweep of time,” said associate director Matthew Battles before running a demo of the website. Designed by Data Visualization Designer Kim Albrecht, Curricle has a sleek, minimalist look. Battles noted that the design “activates course selection and discovery thinking in terms of verbs.” For example, “ Explore,” “Search,” and “Plan” are options on the left-hand sidebar. Clicking one of these modes of operation allows a user to explore courses through networks (not atoms), bringing up “Discovery Visualizations” in charts, maps, and even course clusters.
One particularly impressive visualization is a “Course Universe,” which lays out all the classes offered by departments and schools as clusters of galaxies; a user can drill-down into each galaxy to click on individual stars/courses. (This function was inspired by Albrecht’s art piece “Cosmos,” an immersive visualization of the cosmic web, and shows metaLAB’s signature intersection of art, technology, and science.) Using a Machine Learning approach, Battles explained, Curricle is able to identify similarities in data sets and then visualize that data, with differently constructed algorithms seeing the curriculum in different ways. It’s not that the machine tells students what classes they should be taking, Battles clarified, but rather enables a playful, more intuitive method of course discovery.
Epidemiologist I-Min Lee has published hundreds of papers on exercise and heart health in her time with the Harvard Alumni Health Study and the Women’s Health Study


 One particularly impressive visualization is a “Course Universe,” which lays out all the classes offered by departments and schools as clusters of galaxies; a user can drill-down into each galaxy to click on individual stars/courses. (This function was inspired by Albrecht’s art piece “Cosmos,” an immersive visualization of the cosmic web, and shows metaLAB’s signature intersection of art, technology, and science.) Using a Machine Learning approach, Battles explained, Curricle is able to identify similarities in data sets and then visualize that data, with differently constructed algorithms seeing the curriculum in different ways. It’s not that the machine tells students what classes they should be taking, Battles clarified, but rather enables a playful, more intuitive method of course discovery.