

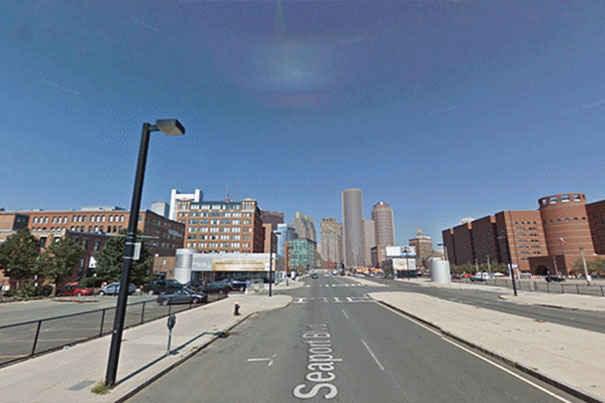
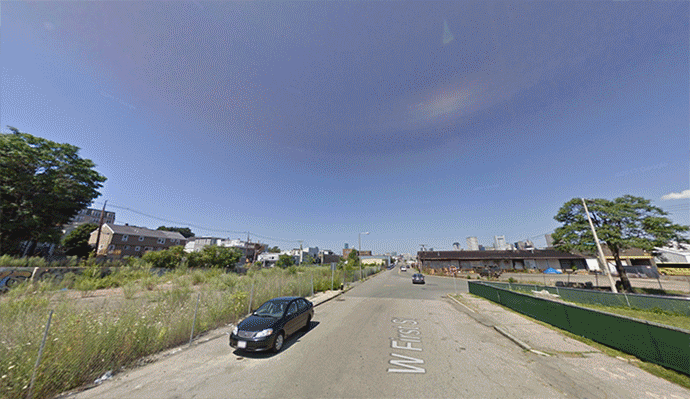
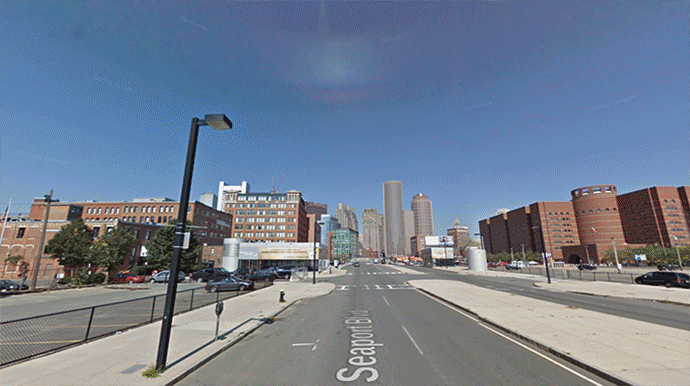
A joint Harvard-MIT study uses an automated computer vision algorithm to study Google Street View images in order to gauge urban change.
Photos by Nikhil Naik and Google, Inc.
Science & Tech
Gauging street change over time
Study uses computer vision algorithm to study Google Street View images to show urban shifts
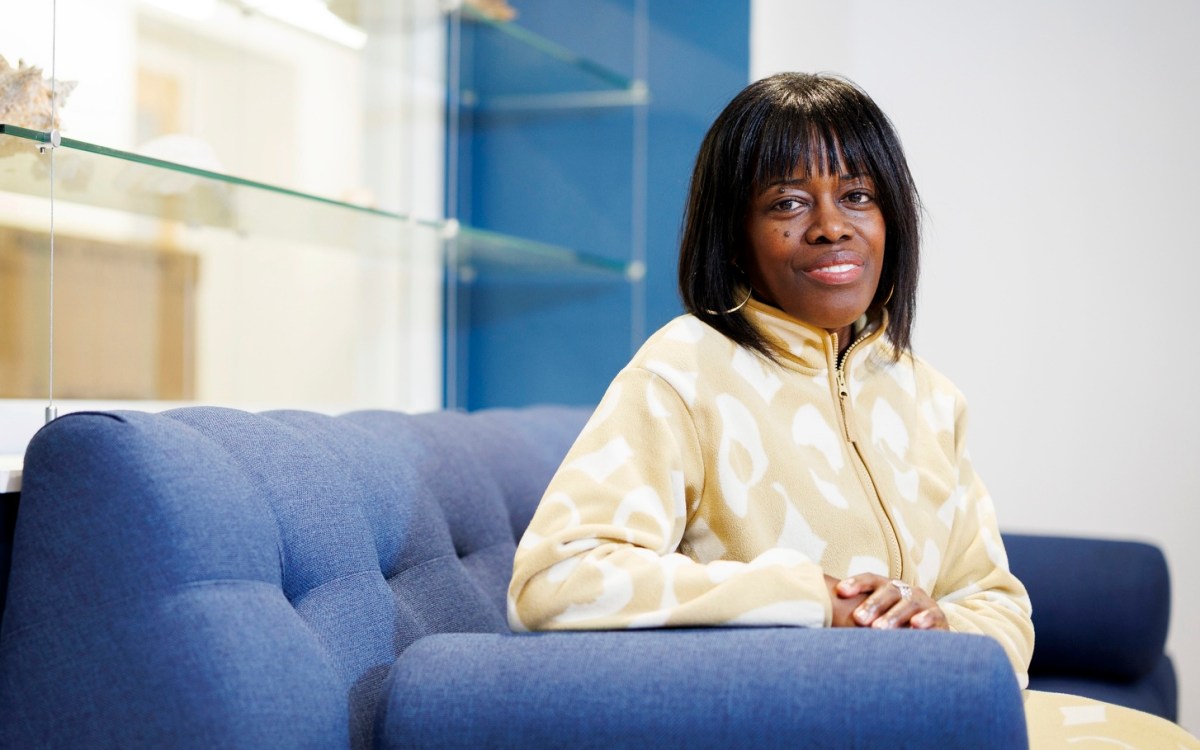
Nikhil Naik, Scott Duke Kominers, and their collaborators are hoping to transform the way scientists study urban environments, with an assist from Google.
In joint work with Edward L. Glaeser, the Fred and Eleanor Glimp Professor of Economics at Harvard, and César A. Hidalgo and Ramesh Raskar, associate professors at the MIT Media Lab, Kominers, an associate professor in the entrepreneurial management unit at Harvard Business School (HBS) and the department of economics, and Naik, a Prize Fellow in economics, history, and politics, authored a study that uses computer vision algorithms to examine millions of Google Street View images to measure how urban areas are changing.
“Lots of people, including social scientists and urban planners, are interested in studying why places evolve and how much change happens in different cities,” Naik said. “But there is a lack of data on the physical aspects of urban change.”
That’s where Google Street View imagery comes in. For the past decade, Naik said, the tech giant has collected millions of Street View images from across the country as part of its mapping service. It also keeps those imaging maps up to date by periodically rephotographing the same locations in major cities. Consequently, Street View contains a rich database that researchers can tap to follow cities through time.
Using Street View images to track urban change isn’t a new idea. In 2014, then-doctoral student Jackelyn Hwang and Robert Sampson, the Henry Ford II Professor of the Social Sciences at Harvard, published a study that employed volunteers to analyze Street View images and locate signs of gentrification across 3,000 city blocks in Chicago.
Naik and co-authors took this effort a step further by using artificial intelligence to automate the process.
“By having a computer do it, we were able to really scale up the analysis, so we examined images of about 1.6 million street blocks from five cities: Boston, New York, Washington, D.C., Baltimore, and Detroit,” Naik said.
At the heart of the system is an artificial intelligence algorithm the collaborators taught to view street scenes the same way humans do. Originally developed in work among Naik, Raskar, and Hidalgo during Naik’s graduate studies at the MIT Media Lab, the algorithm computes “Streetscore,” a rating for perceived safety of streetscapes, based on Street View photos and image preferences collected from thousands of online volunteers.
“We built on this algorithm to calculate Streetchange, the change in Streetscore for pairs of Street View images of the same location captured seven years apart,” Naik said. “A positive value of Streetchange is associated with new construction or upgrades, and a negative value is associated with overall decline.”
In two validation studies — one using images scored by humans, and another using municipal data from the city of Boston — the authors found that their algorithm accurately detected how blocks changed between 2007 and 2014. Armed with Streetchange data generated by the algorithm, Naik and others then took a street-level look at several longstanding theories of urban change involving urban economics, planning, and sociology.
“We found a lot of support for what’s called the ‘human capital agglomeration theory,’ which argues that you tend to see urban improvement when you have a significant density of highly educated individuals,” Kominers said. “The data suggests that other demographic characteristics — factors like income, housing costs, or ethnic composition — do not seem to matter as much as density and education do.”
The study provided some support for a theory called “tipping,” in which neighborhoods that have already developed tend to develop further. The authors also found evidence for the “invasion” theory, which argues that areas around successful neighborhoods, or close to central business districts, tend to see greater improvement over time.
This highlights how urban inequality is real, Kominers said. “Our findings reinforce the extreme importance of human capital and education at all stages of development,” he said. “It matters for people’s access to jobs and livelihoods, but it’s also important to their abilities to improve their environments. And the patterns of urban change we see help illustrate why urban inequality persists.”
Naik said that the study shows that artificial intelligence and geospatial data can be used to measure the built environment and sample populations and to conduct urban science at unprecedented resolution and scale. “We’ve focused on urban change here, but there are many possibilities for the future.”
This research was supported with funding from the International Growth Centre, the Alfred P. Sloan Foundation, a Star Family Challenge grant, the National Science Foundation, the William F. Milton Fund at Harvard, the Ng Fund of the Harvard Center of Mathematical Sciences and Applications, the Human Capital and Economic Opportunity Working Group sponsored by the Institute for New Economic Thinking, the Taubman Center for State and Local Government, the Google Living Labs Award, and a gift from Facebook.
To learn more about Streetchange, visit its website.