


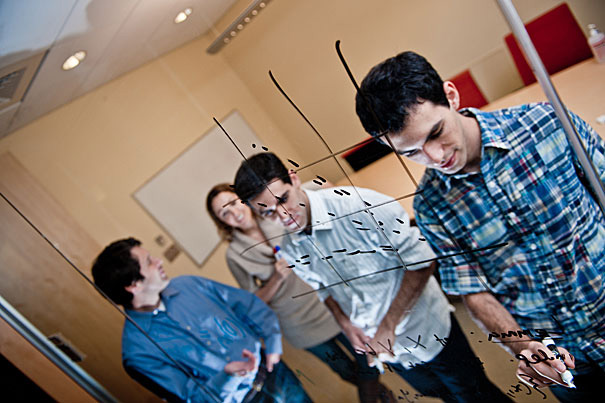
Brothers David (front left) and Yakir Reshef (front right) developed a tool to evaluate massive data sets under the guidance of advisers Michael Mitzenmacher, Gordon McKay Professor of Computer Science, and Pardis Sabeti, assistant professor of organismic and evolutionary biology.
Photo by ChieYu Lin
Science & Tech
Dealing with data
Researchers create versatile, sweeping data-analysis tool
Harvard researchers have developed a tool for analyzing large data sets that detects important relationships in data without prior knowledge of their type. The development comes at a time when researchers are being overwhelmed by the vast amounts of data emerging from their labs, and struggling to make sense of them.
Developed by brothers David Reshef, a current Harvard-MIT M.D./Ph.D. student, and Yakir Reshef ’09, together with Professors Michael Mitzenmacher and Pardis Sabeti of the Harvard Departments of Computer Science and Organismic and Evolutionary Biology, respectively, the data-analysis algorithm is capable of quickly analyzing massive data sets to identify variables that may be related, enabling researchers to pick out potentially meaningful results they might otherwise have missed.
The paper describing the algorithm, published in the Dec. 16 issue of Science, applies the program to four data sets — microbiome data, genetic studies, global health data, and baseball statistics — in an effort to demonstrate its ability to detect relationships.
Just how massive is the flood of data coming from research laboratories?
One of the data sets used in the Science paper concerns the microbial flora of the human gut, and included almost 7,000 bacterial strains in 700 laboratory mice, for a total of more than 22 million possible relationships between bacterial strains, David Reshef said. If each possible relationship were printed on a single sheet of paper, the resulting stack of paper would be about 1.4 miles high, six times taller than the Empire State Building.
“It can easily become overwhelming,” said David. “That’s just one data set, and this one isn’t that large compared to some other data sets that are out there.”
Ironically, the brothers never set out to find a way to sift through huge amounts of data. They stumbled onto the problem three years ago, while working on ways to visualize large sets of public health data. ”As we worked, we realized that in order to visualize relationships in a large data set, you first have to decide which variables to examine,” said Yakir.
David added, “We didn’t know what kinds of things to look for in some of these data sets, and we needed a tool that would give us a quick summary of the data and tell us what variables were most strongly related. But it quickly became clear that this is a question that is much easier to pose than to answer, especially if you don’t know what types of patterns you’re looking for ahead of time.”
Over the next three years, the brothers, working with Sabeti, assistant professor of organismic and evolutionary biology, and Mitzenmacher, the Gordon McKay Professor of Computer Science and area dean for computer science, pursued their solution: an algorithm that forms the basis of a new approach to data analysis.
Though the idea of using a computer to analyze data is far from new, the brothers’ program is unusual in that it makes significant progress toward solving two problems that limited earlier efforts.
“If you have a data set with many variables and you want to know which ones are most strongly associated, you have to deal with the fact that there are different ways they can be related,” said David. “Some things, like the average life expectancy and the average children per woman in countries across the world, might be linearly related. But others, like flu prevalence over time, might show a more cyclical or periodic pattern because flu rates go up in the winter and drop in the summer. There are different tests that are good at capturing each of these different patterns. But making a tool general enough to capture them all is difficult.”
“This gets even more complicated because data are inherently noisy,” added Yakir. “If we have a tool that can find any pattern, we also want it to treat those patterns equitably. We want a score of 0.8 to indicate the same level of noise regardless of what the relationship is.”
Especially significant, Sabeti said, is the fact that the program can find multiple patterns at once.
To demonstrate the importance of finding multiple patterns, Sabeti turned to the data on global health indicators of the World Health Organization that were used in the paper. When female obesity rates are compared with income, she said, the data initially appear to fall along a parabola. That is, initially, obesity rates rise in tandem with incomes. But at a certain point, increased income results in a drop in obesity rates.
While the program can easily spot such a relationship, this one turned out to be more complex. Within the relationship between income and female obesity, there was a second trend occurring simultaneously. Data that at first glance did not appear to follow the previously described trend were actually indicators of different cultural norms. In this case, Sabeti said, the second trend in this relationship represents a cluster of nations with low incomes but very high obesity rates, in which obesity is culturally valued.
“This is just one example of what this algorithm is particularly good at detecting,” she said. “It allows you to find relationships that might be fairly complex or difficult to predict ahead of time, and it allows you to sort through things you wouldn’t have been able to deal with otherwise. As data sets get larger and larger, that becomes more and more important.”
Going forward, Mitzenmacher predicted the tool will prove powerful for researchers.
“What we were trying to design was a tool that we can use to understand data,” he said. “For many data sets, what you’re really doing is exploring. This test allows us to look at each of these comparisons, find those that exhibit an interesting pattern without specifying that pattern ahead of time, and score the strength of those correlations. This algorithm is a data exploration tool for the types of large data sets you see across all the sciences.”