Model helps predict quake damage

Drop a pebble into a still pool and you’ll see a series of smooth, shallow ripples emanating from it in a tidy concentric progression. Drop a computer-simulated earthquake onto a map of, say, Los Angeles, and you’ll see the same thing, right? Not anymore, thanks to a team of Harvard and California Institute of Technology researchers led by John Shaw. Now you’ll see a frantic jumble of jagged peaks and valleys, a bizarre dream of color and motion with no apparent pattern or symmetry. It’s like an animated, three-dimensional, rainbow-hued EKG.
And yet, this mishmash of flashing pixels could save lives.
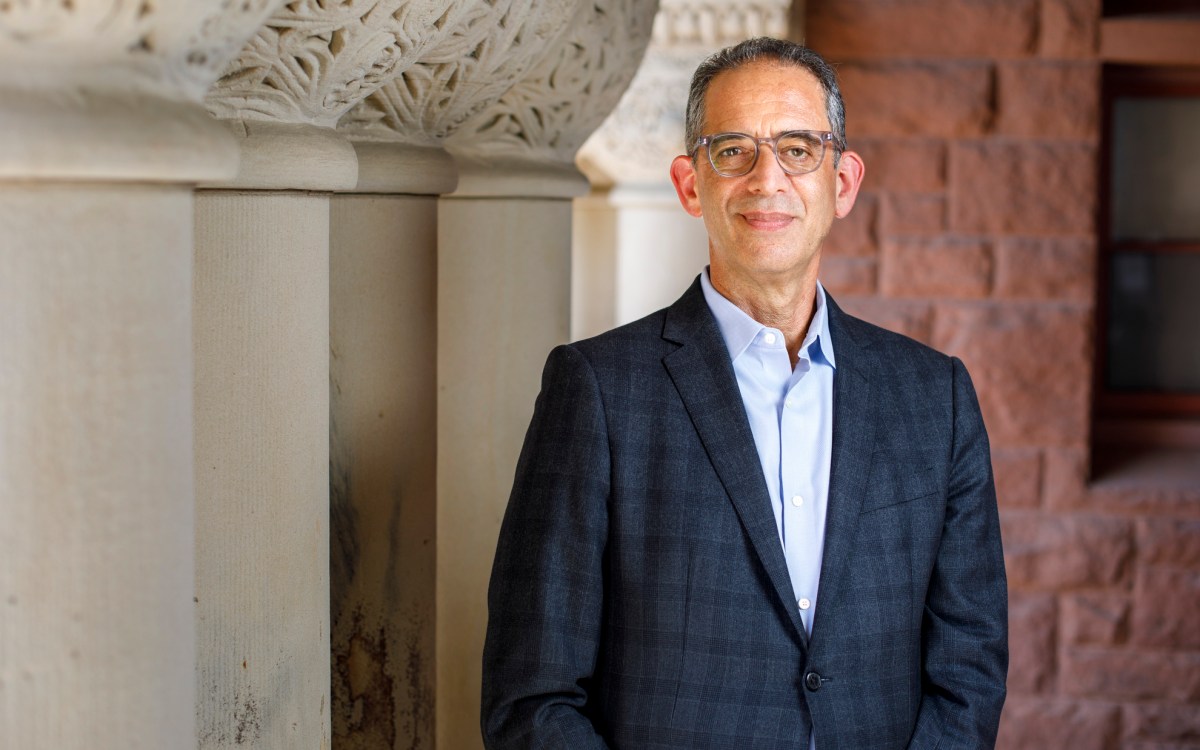
According to Shaw, an associate professor of natural sciences in the Department of Earth and Planetary Sciences at Harvard, “The earthquake-hazard maps currently in use are based on the premise that the closer a building is to a large fault, the better designed it should be. But what these new, comprehensive 3-D models we’ve developed tell us is that this basic rule of proximity doesn’t always work.”
A case in point is the quake that interrupted the 1989 World Series in San Francisco. “There were areas that were very close to the epicenter of that earthquake that were damaged very little,” says Shaw, “and then there were areas like the Marina District that were actually quite far from the earthquake center, which were almost completely devastated.”
The reasons for this are twofold. One is the manner with which an earthquake’s sound waves travel through different strata of rock that underlie the surface layer. The second is the makeup of the ground soil; the Marina District, for instance, was sitting on landfill, which contains a lot of water and is much less stable than, say, bedrock.
“There’s a lot of complexity to the Earth’s structure,” says Shaw. “The simple, old method is just assuming that it’s a one-dimensional structure, that there’s no variation at all. And what we know based on geology and based on experience is that this is a highly complex system.”
It may seem obvious that the surface of the Earth is not smooth and flat like the surface of a still pool, and that therefore an earthquake wouldn’t cause the same kind of orderly ripples as a pebble.
But it wasn’t until Shaw and his colleagues developed their new Earth models and computer simulations that engineers and civic planners could see just how the vagaries of the Earth’s surface could actually affect the buildings sitting on top of it in a seismic event and, in response, alter building codes, earthquake-mitigation systems, infrastructure plans, and emergency-response strategies.
To arrive at the new model, Shaw drew on his experience developing imaging technologies in a research lab at Chevron-Texaco, which opened the door to a data source most academics might never consider: the petroleum industry. “It gave me an awareness of what data’s available,” he says, “and where it exists, so that when I came to Harvard I brought a lot of those connections with me. It also gave me some very practical experience in collecting, acquiring, and processing this data.”
Turns out there’s a huge untapped accumulation of acoustic imaging data (something like an ultrasound) and geophysical data acquired for drilling oil wells that includes measurements of rock properties such as the presence or absence of faults and the pressures of the fluids in rock.
“The oil industry obviously has a very large vested interest in developing technologies that can improve our abilities to image these kinds of features,” Shaw says. “And they’re willing to invest tremendous amounts of money acquiring this kind of data. And in areas particularly areas in California and other areas throughout the world where they are no longer exploring aggressively, either because of environmental concerns or because of lack of success in drilling – this data can be made available.”
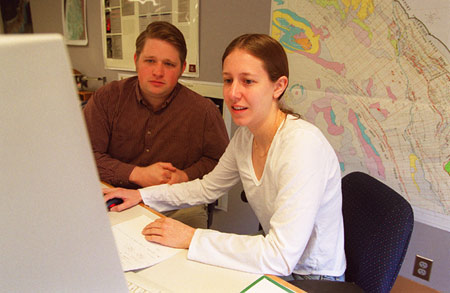
In addition to mining the petroleum-industry data, Shaw has sent teams of young researchers out into the field. “An exciting aspect of this project for me,” he says, “is that we’ve been able to involve so many Harvard students in the data-collection activities.” Using existing data, the teams choose a site with a fault in its subsurface, then go out and gather more specific information, using hammer drops or shaking metal plates to generate sound vibrations in the earth. This gives them a high-frequency sound level that allows them to image not just a few kilometers deep, but up to “the upper few tens of meters.”
Another important element of the model is geologic data. “People used to think that many large earthquakes did not leave any tangible, discrete geologic record near the surface,” Shaw says. “And what we’ve shown is that this is clearly untrue. We can recognize certain features, we know that there’s a fault, we know what size earthquake it generated, and we can date the geologic strata over it. This is important because for a fault system to be really credibly considered dangerous, there has to be evidence that it has caused an earthquake in the last 10,000 years. And its perceived importance increases with the higher frequency of events you can establish. This way you can study not just one fault, but all the faults in an area and how they behave as a system. That allows us to simulate the earthquakes more realistically.”
Shaw then enters all this information into the computer, and builds the models “by layer cake,” laying one grid on top of another until he has an accurate three-dimensional picture of the Earth’s interior. “In the case of L.A.,” he says, “we have more than 80,000 independent measurements. We’re clearly at the point where we’re ready to meet a higher standard using more data. And the more information we have the better job we’ll do, particularly the better job we’ll do in terms of trying to mitigate earthquake damage and loss.”
And that’s no drop in the bucket.


