


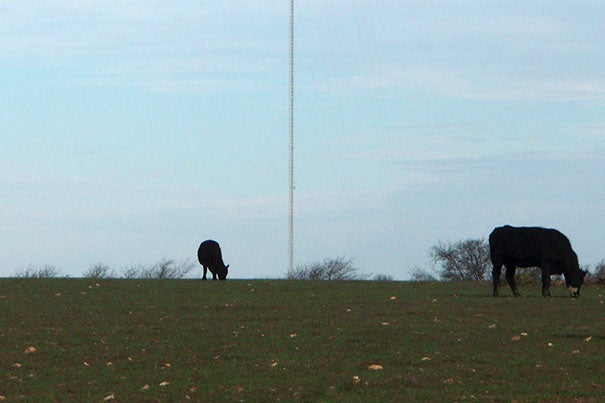
This NOAA tall tower greenhouse gas observatory near Moody, Texas, collects data on methane in the atmosphere. The report also indicates that the contribution from livestock operations may be twice as high as previously thought. Photo courtesy of NOAA’s Earth System Research Laboratory
Photo by Roy Kaltschmidt/Lawrence Berkeley National Laboratory
Science & Tech
U.S. methane emissions exceed government estimates
Collaborative study indicates fossil fuel extraction, animal husbandry major contributors
Emissions of methane from fossil fuel extraction and refining activities in the South Central United States are nearly five times higher than previous estimates, according to researchers at Harvard University and seven other institutions. Their study, published this week in Proceedings of the National Academy of Sciences (PNAS), also suggests that the contribution from livestock operations may be twice as high as previously thought.
Methane, a potent greenhouse gas, is produced through natural gas production and distribution, cattle farming, landfills, coal mining, manure management, and other anthropogenic and natural sources, though human activities are thought to contribute approximately 60 percent of the total.
Overall, according to the new study, total methane emissions in the United States appear to be 1.5 times and 1.7 times higher than the amounts previously estimated by the U.S. Environmental Protection Agency (EPA) and the international Emissions Database for Global Atmospheric Research (EDGAR), respectively.
The difference lies in the methodology. The EPA and EDGAR use a bottom-up approach, calculating total emissions based on “emissions factors” — the amount of methane typically released per cow or per unit of coal or natural gas sold, for example. The new study takes a top-down approach, measuring what is actually present in the atmosphere and then using meteorological data and statistical analysis to trace it back to regional sources.
Generated by a large, multi-institutional team of researchers, the latest findings offer a comprehensive baseline for assessing policies designed to reduce greenhouse gases. They also point to a few areas where the assumptions built into recent emissions factors and estimated totals may be flawed.
“The bottom-up and top-down approaches give us very different answers about the level of methane gas emissions,” notes lead author Scot M. Miller, a doctoral student in Earth and Planetary Sciences through the Harvard Graduate School of Arts and Sciences. “Most strikingly, our results are higher by a factor of 2.7 over the South Central United States, which we know is a key region for fossil-fuel extraction and refining. It will be important to resolve that discrepancy in order to fully understand the impact of these industries on methane emissions.”
Along with carbon dioxide, methane is one of the most important greenhouse gases in terms of its potential to raise global temperatures.
Miller is a 2007 graduate of Harvard College and earned a master’s degree in engineering sciences at the Harvard School of Engineering and Applied Sciences (SEAS) in 2013. He studies in the lab of Steven C. Wofsy, Abbott Lawrence Rotch Professor of Atmospheric and Environmental Science at SEAS.
“When we measure methane gas at the atmospheric level, we’re seeing the cumulative effect of emissions that are happening at the surface across a very large region,” says Wofsy, a co-author of the PNAS study. “That includes the sources that were part of the bottom-up inventories, but maybe also things they didn’t think to measure.”
Miller and Wofsy, along with colleagues at the Carnegie Institution for Science, the National Oceanic and Atmospheric Administration (NOAA), and five other institutions, used a combination of observation and modeling to conduct their analysis.
NOAA and the U.S. Department of Energy collect observations of methane and other gases from the tops of telecommunications towers, typically about as tall as the Empire State Building, and during research flights. The team combined this data with meteorological models of the temperatures, winds, and movement of air masses from the same time period, and then used a statistical method known as geostatistical inverse modeling to essentially run the model backward and determine the methane’s origin.
The team also compared these results with regional economic and demographic data, as well as other information that provided clues to the sources — for example, data on human populations, livestock populations, electricity production from power plants, oil and natural gas production, production from oil refineries, rice production, and coal production. In addition, they drew correlations between methane levels and other gases that were observed at the time. For example, a high correlation between levels of methane and propane in the south-central region suggests a significant role for fossil fuels there.
“This paper provides the most solid and the most detailed estimate to date of total U.S. methane emissions,” says co-author Anna M. Michalak, a faculty member in the Department of Global Ecology at the Carnegie Institution for Science. Michalak is also an associate professor of environmental Earth system science at Stanford University. “This was really, from beginning to end, just a very clean analysis.”
Along with carbon dioxide, methane is one of the most important greenhouse gases in terms of its potential to raise global temperatures. It also encourages the formation of surface ozone in cities and affects other aspects of atmospheric chemistry.
Seeking to establish a baseline against which to measure future change in methane emissions, the researchers compared observational data collected in 2007–08 with EDGAR and EPA data for the same year (using the revised EPA data for 2007–08 that was published in April 2013). Future studies will apply the same analysis to present-day data.
“The beauty of the approach we’re using is that, because we’re taking measurements in the atmosphere, which carry with them a signature of everything that happened upwind, we get a very strong number on what that total should be,” says Michalak. “Now that we know the total does not equal the sum of the parts, that means that either some of those parts are not what we thought they were, or there are some parts that are simply missing from the inventories. It really offers an opportunity for governments to re-examine the inventories in light of what we now know.”
In addition to Miller, Wofsy, and Michalak, co-authors included Eric A. Kort, S.M. ’05, Ph.D. ’11, who is now a faculty member at the University of Michigan, Ann Arbor; Arlyn E. Andrews, Ph.D. ’00, Edward J. Dlugokencky, and Stephen A. Montzka at NOAA’s Earth System Research Laboratory; Sebastien C. Biraud and Marc L. Fischer at Lawrence Berkeley National Laboratory; Janusz Eluszkiewicz and Thomas Nehrkorn at Atmospheric and Environmental Research in Lexington, Mass.; Greet Janssens-Maenhout at the European Commission Joint Research Centre in Italy; and Ben R. Miller, John B. Miller, and Colm Sweeney at the University of Colorado Boulder.