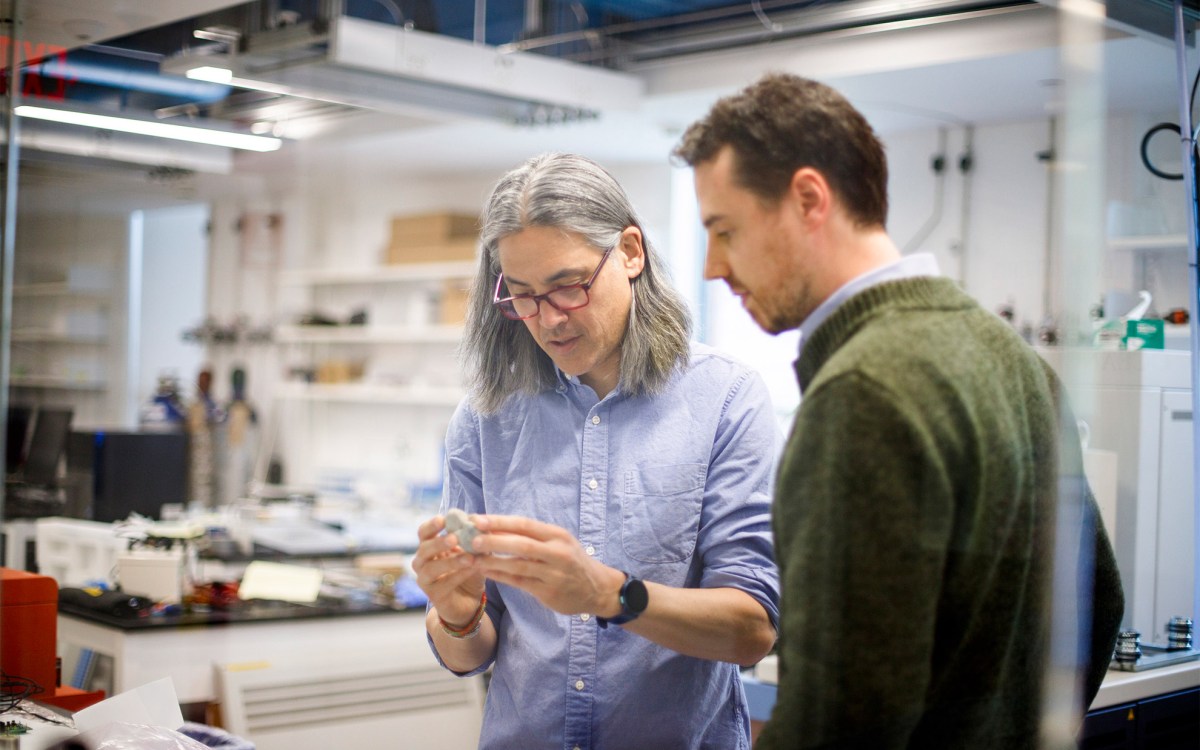
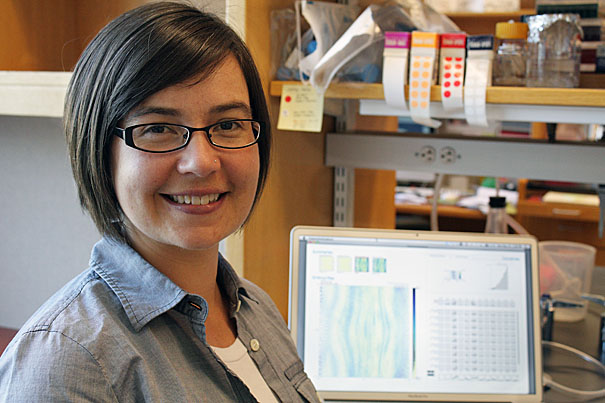
Modern biologists are “essentially swimming” in data,” says Miriah Meyer “— well drowning in it, really. It’s the perfect time for a field like visualization to make an impact and enable scientists to make sense of all this data.”
Photo by Angela Alberti
Science & Tech
Computer imaging that aids science
Meyer uses visualization techniques to analyze, display data
Miriah Meyer isn’t a biologist, but she helps biologists better understand their work.
A postdoctoral research fellow in computer science in Harvard’s School of Engineering and Applied Sciences (SEAS), Meyer spends her work hours not at SEAS, but rather in a biology lab at Harvard Medical School, learning how DNA affects the development of thousands of tiny cells inside fruit fly embryos. She doesn’t meticulously research and document each cell’s gene expression profile. Instead, she uses her expertise to reveal the minute differences and similarities across many species’ profiles to the scientists who do the research.
“I love immersing myself in a new and different culture, whether that’s a foreign country or a new scientific field of research,” says Meyer. “I really enjoy learning about new ideas and interactions, in both societal and scientific cultures.”
As a computer scientists, Meyer specializes in the emerging field of visualization, which uses graphic computer representations to help scientists and others envision, manage, and interact with large quantities of complex data in ways that would otherwise be impossible.
“In the last decade biologists acquired vast amounts of quantitative data, starting with the sequencing of the human genome,” she explains. “They’re essentially swimming in this data — well drowning in it, really. It’s the perfect time for a field like visualization to make an impact and enable scientists to make sense of all this data.”
Meyer sees visualization as the happy marriage of art and science, of new discovery and in-depth learning, of being a sightseer and an architect of new cultures. It’s no surprise that she is the daughter of an artist mother and chemist father, who spent her childhood both sculpting clay and learning basic computing.
She grew up Powhatan, Va., a small town outside of Richmond, where she attended a school named after Pocahontas, another woman who bridged cultures. Math and science were her favorite subjects from an early age, and she earned a Bachelor’s degree in astronomy and astrophysics at Pennsylvania State University.
“I assumed that I would go to grad school. But at the time, I wasn’t focused enough to study one thing for the rest of my life. I wasn’t ready yet,” she says. So she took a year off to explore the world, traveling to Australia, Mauritania, Thailand, Fiji, Nepal and across the United States.
Meyer moved to Massachusetts in 2000 and began work as a software engineer at Raytheon. She spent evenings taking classes at Harvard Extension School, where Hanspeter Pfister, who is now the Gordon McKay Professor of the Practice of Computer Science in Harvard’s School of Engineering and Applied Sciences, was her computer graphics instructor. “It was literally after that first week of class that I thought computer graphics was awesome and I wanted to go to grad school for computer science,” Meyer says.
Meyer decided to attend the University of Utah, where she also worked in the Scientific Computing and Imaging Institute and earned a Ph.D. in computer science. (Ironically, she chose Utah because of the rock climbing opportunities it offered, but her first week there she fell while climbing in an indoor facility, injured her knee, and never climbed again.) During her studies, Meyer was drawn to the field of visualization because it allowed her to interact with the scientific research community. “It was a way to be involved in science without being the scientist doing the experiments and observations,” she says.
“As a global community, we have tons of data, whether medical, financial, or from scientific devices. So, all this data, underneath it’s just a bunch of numbers,” Meyer says, adding that visualization is a helpful tool in making sense of enormous amounts of data. “As humans, our brains are like a computer with limited memory. So we can rely on the outside world as an external hard drive. We can store all this information in diagrams or graphs or whatever. In visualization, we rely on our perceptual system to be able to see patterns and see trends,” she says.
Her research in Utah included taking what is called volumetric data, from MRIs or CT scans, and mapping that data into interactive 3-D images for physicians. Her work enabled doctors to see various layers and organs inside the human body more realistically, and interactively. “I was really interested in doing more multidisciplinary work and working very closely with end users. Visualization is really about designing and developing visual encodings of data to help scientists make better sense of the relationships within that data,” Meyer says.
Around the time Meyer completed her Ph.D., Pfister accepted a position at SEAS, and was looking for someone to do multidisciplinary research in his lab. Meyer proved to be the person he was seeking. “I assumed, because I have an astronomy degree, that I would be working with physicists and physical scientists. But within the first two months of my postdoc, I started meeting biologists and found out that biology is in the midst of a data revolution right now,” Meyer says, referring to biological breakthroughs including the decoding of mammalian genomes, and quantitative gene expression data.
Meyer began her postdoctoral research developing visual tools for biologists in the Systems Biology Department at Harvard Medical School, helping them track gene expression in 13 species of fruit fly embryos. “One of the things I’ve liked most is the Harvard community, and just being in Cambridge, is that there’s so much interesting interdisciplinary science going on,” Meyer says. “Once I started talking to one or two people, it just blossomed. I’m working in three different labs right now, on three different projects, and that’s just the tip of the iceberg.”
In her collaborations, Meyer attempts a deep understanding her collaborator’s research by spending time in their laboratories. “Having an interest and a curiosity in other people and in what they do is what attracted me to the work I do. You get to work with other people and talk with them about their own science and learn about what they do,” she says.
Meyer calls on background as a traveler to understand the relationships of data sets in complex scientific experiments, and she synthesizes that knowledge into a visual and interactive representation of the research data. “There’s that same cultural experience for me as a computer scientist going into a biology lab that’s similar to what I love most about traveling to other places,” she says. “It’s very much like learning a new culture.”
She first works with scientists to figure out what their goals are. “A huge part of what I do is to get inside the head of researchers to understand what they truly want to see out of their data. Then I translate their data into a computer science language that I understand,” Meyer says. She then writes software and designs interactive computer tools that process the data, and converts it into interactive images. Using her tools, scientists can rely on their perception, rather than cognition, to more easily see patterns and trends.
For example, when Meyer clicks her computer’s mouse over a single fruit fly cell represented on her computer screen, a row automatically appears showing an easily discernable gene expression profile for that specific cell at a particular time point in the experiment. There are also links to similarly located cells in other species, and direct mapping to a 3-D image of the embryo, so that the biologists can compare gene expression within a single embryo or across species.
The data in most of the projects Meyer collaborates on is brand new and tools hadn’t existed for scientists to see or interact with it. Through computer visualizations, the biologists were able to interact with their data in new ways and to more easily see patterns. This improved understanding of the data helped the researchers to reassess the direction and methods of their experiments. “With this tool, they started looking at the data and realized some of the computational work they were doing was not the best way to look at it. It allowed them to see that one of their data sets was plagued with low levels of noise, so they went back to regenerated that data,” Meyer says.
Meyer has another year of work in the Pfister Lab, but says she hopes to remain in Cambridge because of the exciting opportunities in computing, visualization, and biology in the area. “I get to learn about all this cool science, then there’s a fun design side in encoding the data, and the geeky computer science stuff that I love. It’s a wonderful mixture of a lot of different fields,” Meyer says.
“Postdocs, by nature, are a temporary thing. They’re a stepping-stone to the rest of your career. Part of me is anxious to get started. But on the other hand, I have an incredible amount of freedom right now,” Meyer says. “I’ve had a dream postdoc. It’s this really blissful period where you get to focus on your research and that’s it. It’s a ton of fun.”