

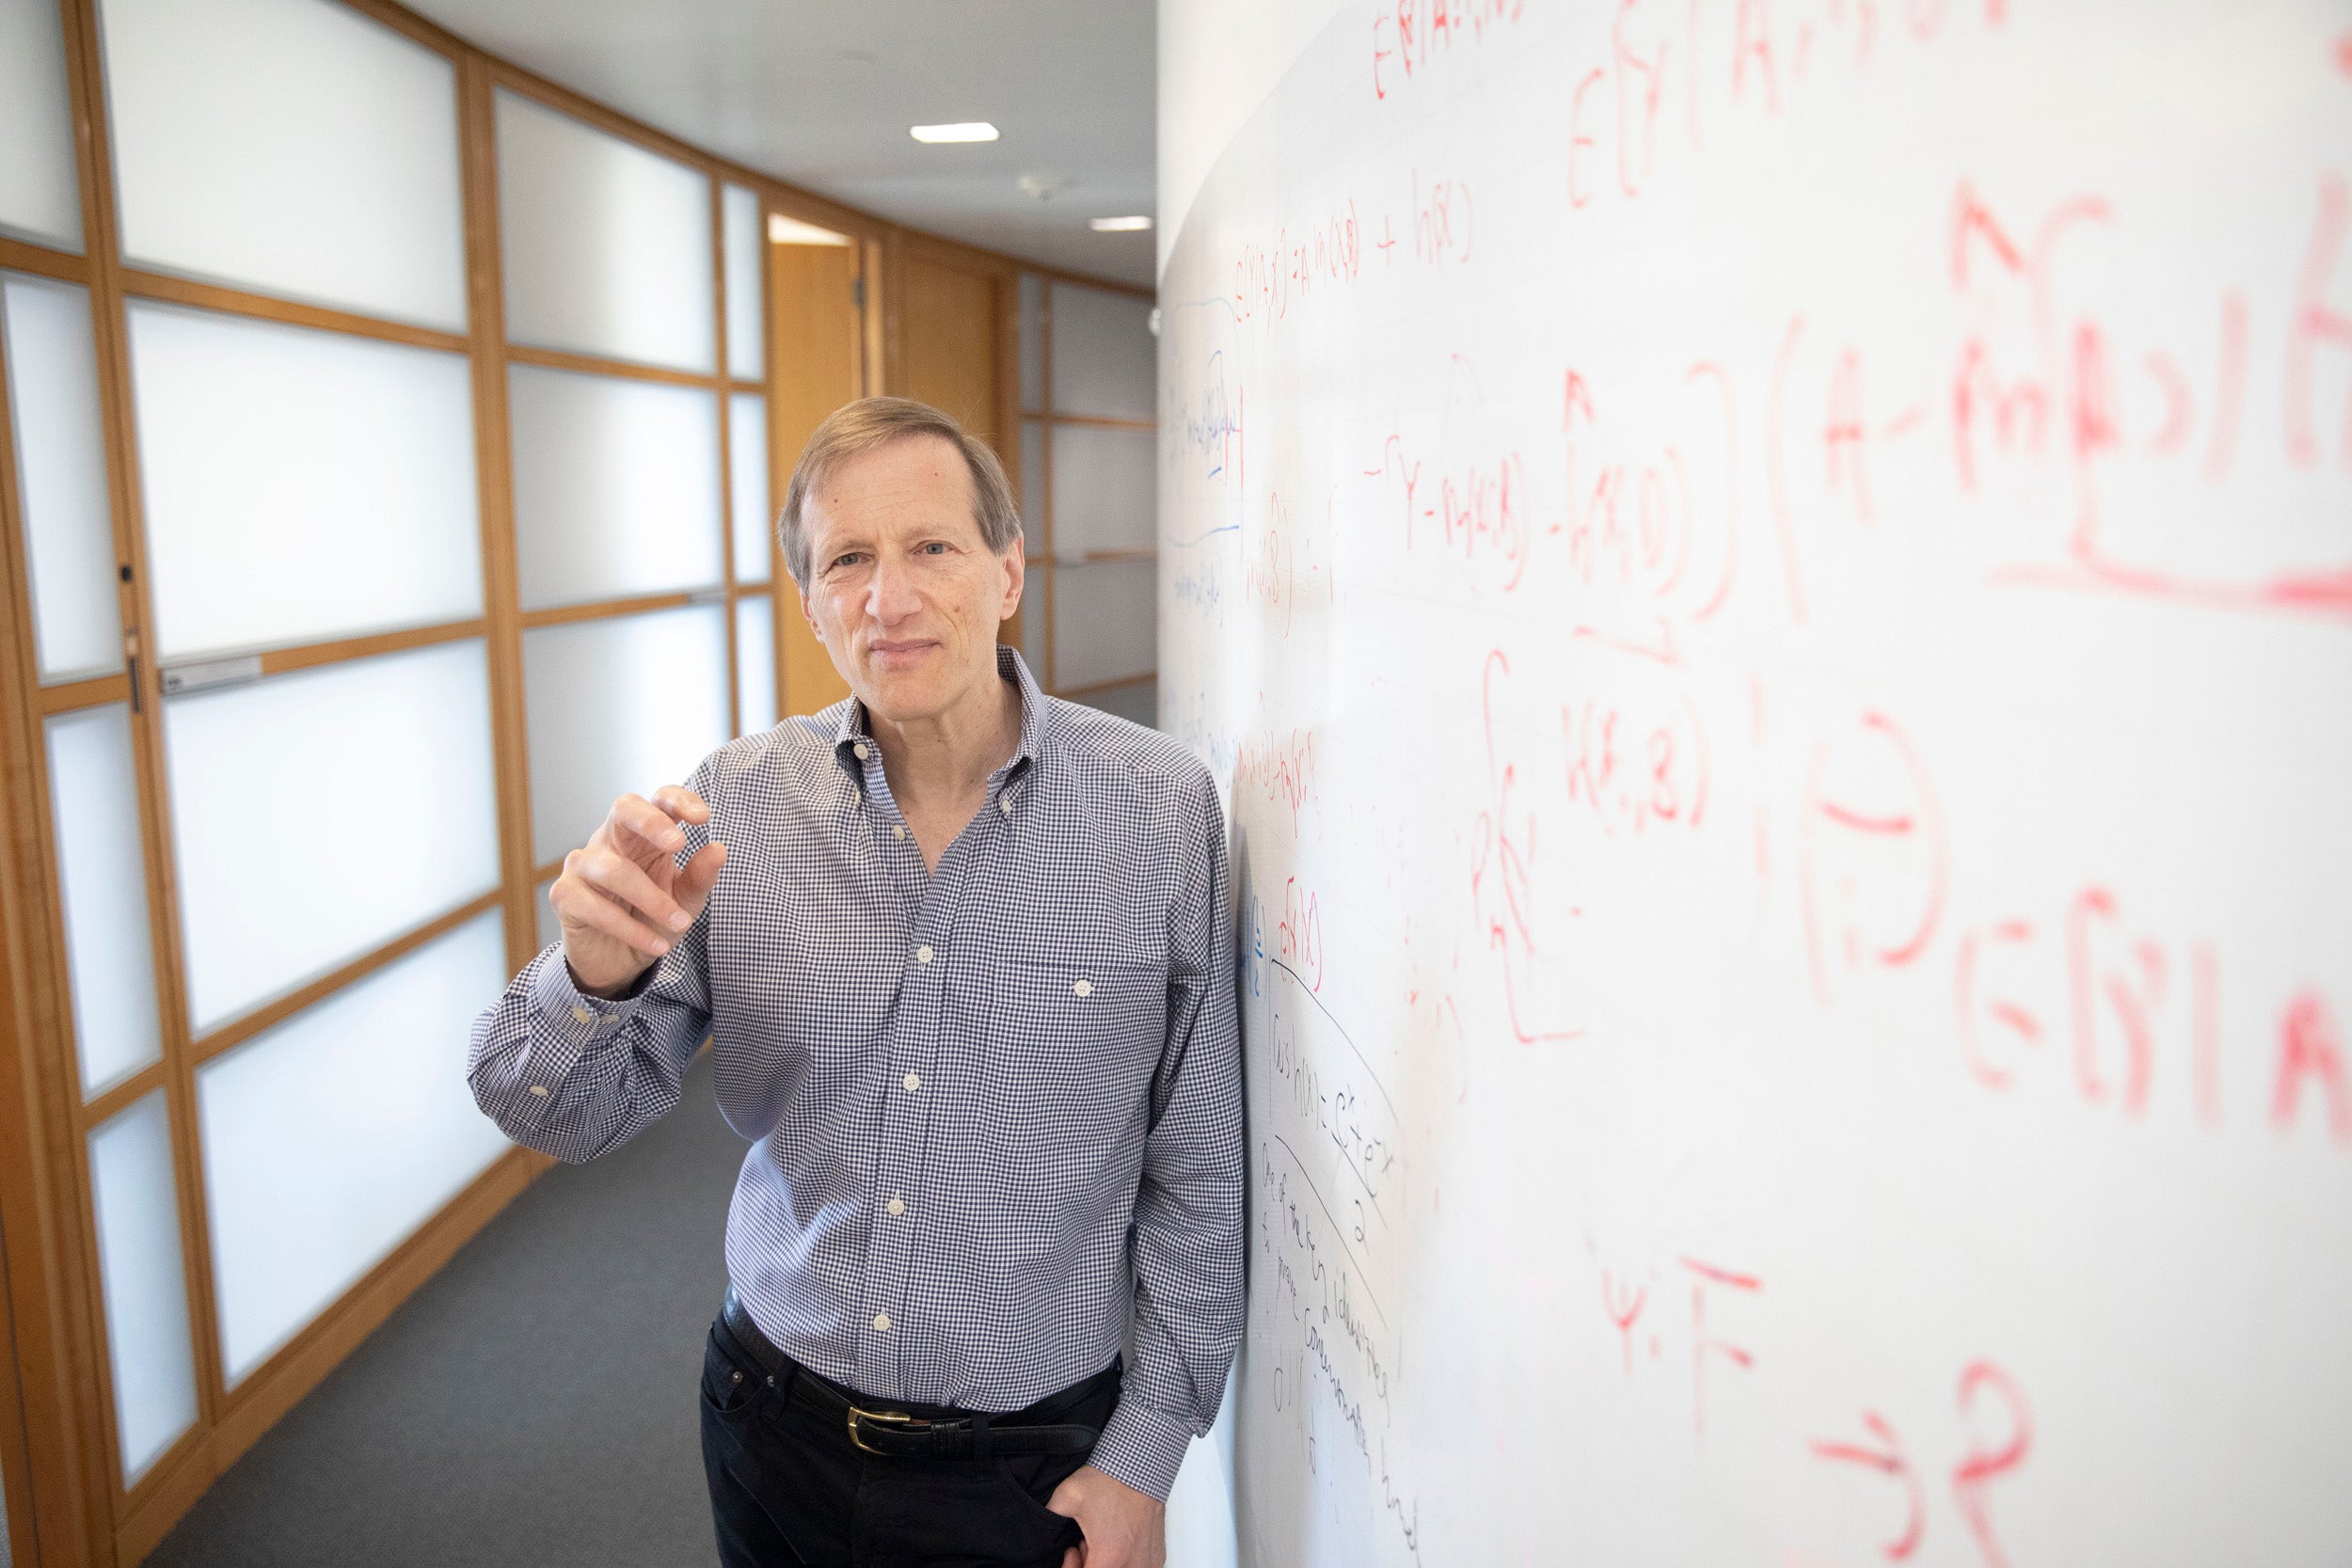
The standard prediction model has been used to indulge reporters desperately seeking election forecasts, says Gary King, who along with colleagues developed a statistical model that has proven more reliable.
Kris Snibbe/Harvard Staff Photographer
Nation & World
Election forecasts often miss. Annoying, yes, but real problem for scholars
Researchers come up with better, more accurate model that also unearths fresh insights into American democracy
Elections are nail-biting affairs for several reasons, including their seeming lack of predictability. Forecasts of results delivered with great confidence before balloting regularly get upended.
For journalists and voters the whole thing can be unsettling. But for political scientists the problems run deeper. After all, flawed forecasting models say something about their understanding of how the whole process works.
A group of researchers working at the intersection of statistics and the social sciences say they have an answer. In a newly released working paper, Gary King, the Albert J. Weatherhead III University Professor and director of the Institute for Quantitative Social Science, introduces a novel statistical model and tests its reliability on more than 10,000 U.S. congressional races over more than six decades. More important to King and his co-authors — Professor Jonathan N. Katz and graduate student Danny Ebanks of Caltech — is that their improved method uncovered fresh insights about American democracy.
Forecasting elections is “often fun but rarely a major scientific issue,” noted King, a political scientist and statistician. Major issues for political scientists include whether redistricting, registration, and voting rules are fair, or whether the Electoral College biases elections in favor of one party or the other. “In our paper, we also ask whether incumbents are being elected with such consistently high probabilities that they never need to worry about their jobs, and so the responsiveness of legislators to the public vanishes,” King added.
When political scientists predict elections, their primary motivation is validating models used to study these scholarly interests. In King’s estimation, it takes “a delusional level of optimism” to apply models that perform badly when predicting elections “for learning about deeply important features of American democracy that cannot be directly verified.”
The standard model has been nonetheless used to indulge reporters desperately seeking forecasts. “Political scientists have been using this model for decades,” said King, who includes himself in that camp. After all, the standard model works well enough for certain statistical quantities. “But if you look at full probabilistic predictions of elections needed for understanding the big picture about democracy, it’s just terrible,” he said.
As the paper points out, the problem starts with the standard model failing to account for multiple “known unknowns,” to borrow a phrase from former Secretary of Defense Donald Rumsfeld, or widely understood factors that regularly influence elections while being difficult to incorporate into modeling. The old model accounts for just one of these factors, something called “district uniqueness” — perhaps a longtime representative holds to an idiosyncratic ideology.
The new model, which King et al. introduced at the annual meeting of the Society for Political Methodology last summer, adds four additional “known unknowns.” One is for district-level political surprises — say, a sudden criminal indictment or what political scientists call an “heresthetical maneuver,” where a candidate’s strategic move upends the whole agenda. Another is for coast-to-coast swings that shift the balance for one party or the other.
The data scientists used their model to analyze 10,778 U.S. congressional district-level contests from 1954 to 2020, an approach, with its highly attuned algorithm, that “would have been computationally infeasible even a few years ago.” The co-authors acquired a new high-performance server for the purpose of running their dataset. A full analysis still took 48 hours.
Certain outcomes were assigned probabilities of one in 10,000 or smaller by the standard model. Yet events with these long odds occurred in 12 of 435 elections in 1958 alone. In contrast, when using the new model, such discrepancies were found in only one election in the whole data set. In other words, the new model generated more accurate probabilities so an event expected to happen about one in five times overall actually took place 20 percent of the time.
King and his co-authors quickly applied their model to studying large-scale patterns in congressional elections and American democracy more generally. One finding was not exactly a revelation, except for finally fitting with a statistical model and its empirical results. They found that the past six decades broke into three distinct epochs concerning election results and the two-party system.
Parties appeared to be highly aligned (meaning they were internally consistent and distinct from one another) in the 1950s and ’60s, and again after 2000. The new model found elections were highly predictable across both periods, though political surprises occurred more frequently than the standard model would suggest.
However, the 1950s and ’60s differ from today in one key respect. “In the early period, the parties were aligned, but they weren’t very polarized,” King explained. “Both parties would shoot to capture voters in the middle. Today the parties are still highly aligned. They just happen to be polarized and so highly partisan. They’re not shooting for the median voter; they’re appealing to their extreme supporters.”
What happened in the period in between? The earlier alignment lost much of its value in the 1970s, ’80s, and ’90s, the paper explained, perhaps due to factors including the Civil Rights Act of 1964 and younger voters’ opposition to the policies of both parties in Vietnam. Not surprisingly, elections grew more uncertain during this era.
As political parties struggled to organize voters, incumbents worked to become more powerful and independent. “A whole literature grew up watching the average advantage of incumbency increase through the ’80s and into the ’90s,” King said. “What that meant was the expected vote was higher for incumbents. A big surprise that we found is, it did not mean incumbents were more likely to be elected, because when the expected incumbency advantage was higher, the uncertainty around the prediction was much higher.”
In fact, the new statistical model reveals the very first properly calibrated probabilities concerning incumbent wins and losses. It turns out the probability of incumbency loss remained relatively constant and quite high across all three epochs. And there’s one scenario when it’s downright dangerous to be an incumbent, with a one in five chance of getting fired by voters.
“We show that incumbents of the president’s party have — and always had — about a 20 percent probability of losing their seats in a midterm election,” King said. “They can lose in any other period, but that’s when we see a lot of them wiped out, or at least those not paying close attention to the needs and preferences of their constituents.”