


Science & Tech
Solving a statistical nightmare
New research from Harvard corrects decades of sea surface temperature data, solving a long-standing mystery about global climate change.
Correcting historic sea surface temperature measurements reveals a simpler pattern of ocean warming
Something odd happened in the oceans in the early 20th century. The North Atlantic and Northeast Pacific appeared to warm twice as much as the global average, while the Northwest Pacific cooled over several decades.
Atmospheric and oceanic models have had trouble accounting for these differences in temperature changes, leading to a mystery in climate science: Why did the oceans warm and cool at such different rates in the early 20th century?
Now, research from Harvard University and the U.K.’s National Oceanography Centre points to an answer as mundane as a decimal point truncation and as complicated as global politics. Part history, part climate science, the research corrects decades of data and suggests that ocean warming occurred in a much more homogenous way.
The research is published in Nature.
Humans have been measuring and recording the sea surface temperature for centuries. Sea surface temperatures helped sailors verify their course, find their bearings, and predict stormy weather.
Until the 1960s, most sea surface temperature measurements were taken by dropping a bucket into the ocean and measuring the temperature of the water inside.
The National Oceanic and Atmospheric Administration (NOAA) and the National Science Foundation’s National Center for Atmospheric Research (NCAR) maintain a collection of sea surface temperature readings dating back to the early 19th century. The database contains more than 155 million observations from fishing, merchant, research, and navy ships from all over the world. These observations are vital to understanding changes in ocean surface temperature over time, both natural and anthropogenic.
They are also a statistical nightmare.
How do you compare, for example, the measurements of a British Man of War from 1820 with those from a Japanese fishing vessel from 1920 or a U.S. Navy ship from 1950? How do you know what kind of buckets were used, and how much they were warmed by sunshine or cooled by evaporation while being sampled? Water in a canvas bucket left on deck for three minutes under typical weather conditions can cool by an additional 0.5 degrees Celsius than water in a wooden bucket measured under the same conditions. Given that global warming during the 20th century was about 1 degree Celsius, the biases associated with different measurement protocols require careful accounting.
“There are gigabytes of data in this database and every piece has a quirky story,” said Peter Huybers, professor of Earth and planetary sciences and of environmental science and engineering at the Harvard John A. Paulson School of Engineering and Applied Sciences (SEAS) and senior author of the paper. “The data is rife with peculiarities.”
A lot of research has been done to identify and adjust for these peculiarities. In 2008, for example, researchers found that a jump of 0.3 degrees Celsius in sea surface temperatures in 1945 was the result of measurements taken from engine room intakes. Even with these corrections, however, the data is far from perfect and there are still unexplained changes in sea surface temperature.
Huybers and his colleagues proposed a comprehensive approach to correcting the data, using a new statistical technique that compares measurements taken by nearby ships.
“Our approach looks at the differences in sea surface temperature measurements from distinct groups of ships when they pass nearby, within 300 kilometers and two days of one another,” said Duo Chan, a graduate student in the Harvard Graduate School of Arts and Sciences and first author of the paper. “Using this approach, we found 17.8 million near crossings and identified some big biases in some groups.”
The researchers focused on data from 1908 to 1941, broken down by the country of ship’s origin and the “decks,” the marine observations stored using decks of punch cards. One deck includes observations from both Robert Falcon Scott’s and Ernest Shackleton’s voyages to the Antarctic.
“These data have made a long journey from the original logbooks to the modern archive and difficult choices were made to fit the available information onto punch cards or a manageable number of magnetic tape reels,” said Elizabeth Kent, a co-author from the U.K. National Oceanography Centre. “We now have both the methods and the computer power to reveal how those choices have affected the data, and also pick out biases due to variations in observing practice by different nations, bringing us closer to the real historical temperatures.”
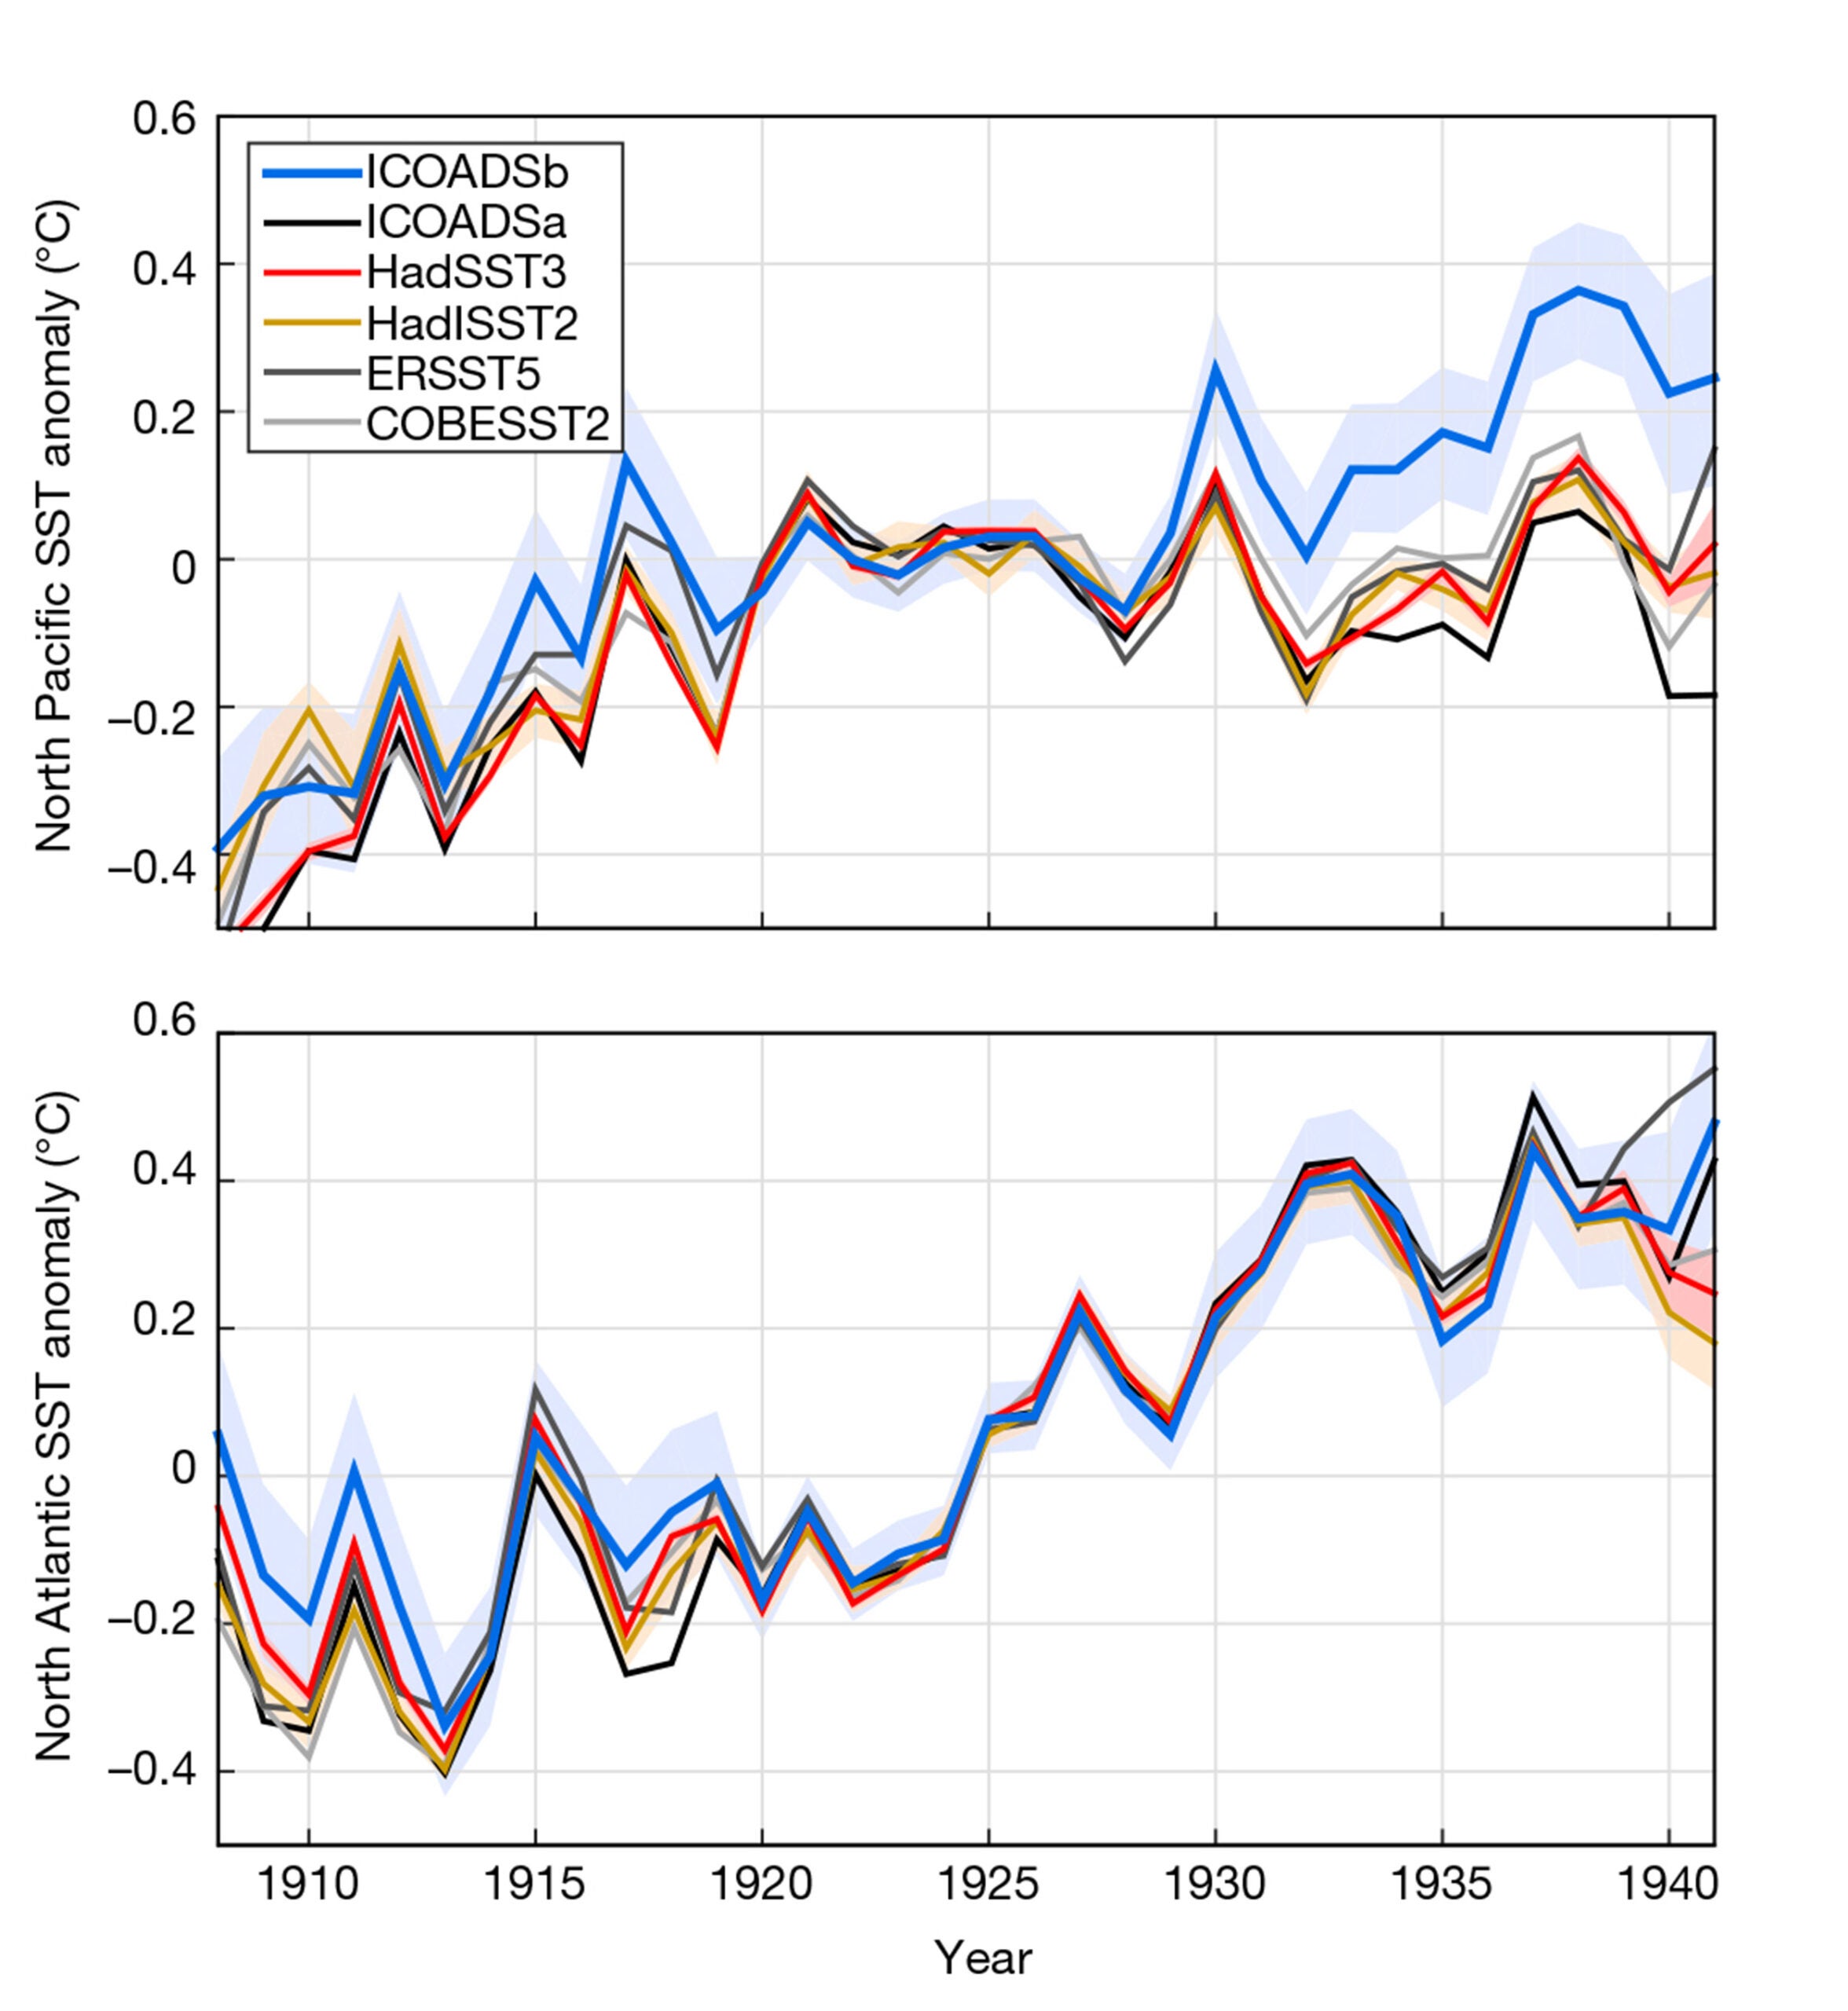
The researchers found two new key causes of the discrepancies in the North Pacific and North Atlantic.
The first had to do with changes in Japanese records. Prior to 1932, most records of sea surface temperature from Japanese vessels in the North Pacific came from fishing vessels. This data, spread across several different decks, was originally recorded in whole degrees Fahrenheit, then converted to Celsius, and finally rounded to tenths of a degree.


However, in the lead-up to World War II, more and more Japanese readings came from naval ships. These data were stored in a different deck and when the U.S. Air Force digitized the collection they truncated the data, chopping off the tenths-of-a-degree digits and recording the information in whole degrees Celsius.
Unrecognized effects of truncation largely explain the rapid cooling apparent in estimates of Pacific sea surface temperatures between 1935 and 1941, said Huybers. After correcting for the bias introduced by truncation, the warming in the Pacific is much more uniform.
While Japanese data holds the key to warming in the Pacific in the early 20th century, it’s German data that plays the most important role in understanding sea surface temperatures in the North Atlantic during the same time.
In the late 1920s, German ships began providing the majority of data in the North Atlantic. Most of these measurements are collected in one deck, which, when compared with nearby measurements, is significantly warmer. When adjusted, the warming in the North Atlantic becomes more gradual.
With these adjustments, the researchers found that rates of warming across the North Pacific and North Atlantic become much more similar and have a warming pattern closer to what would be expected from rising greenhouse gas concentrations. However, discrepancies remain and the overall rate of warming found in the measurements is still faster than predicted by model simulations.
“Remaining mismatches highlight the importance of continuing to explore how the climate has been radiatively forced, the sensitivity of the climate, and its intrinsic variability. At the same time, we need to continue combing through the data — through data science, historical sleuthing, and a good physical understanding of the problem, I bet that additional interesting features will be uncovered,” said Huybers.
This research was co-authored by David I. Berry from the U.K. National Oceanography Centre.
The research was supported by the Harvard Global Institute, the National Science Foundation, and the Natural Environment Research Council.