
Science & Tech
The giant in our stars
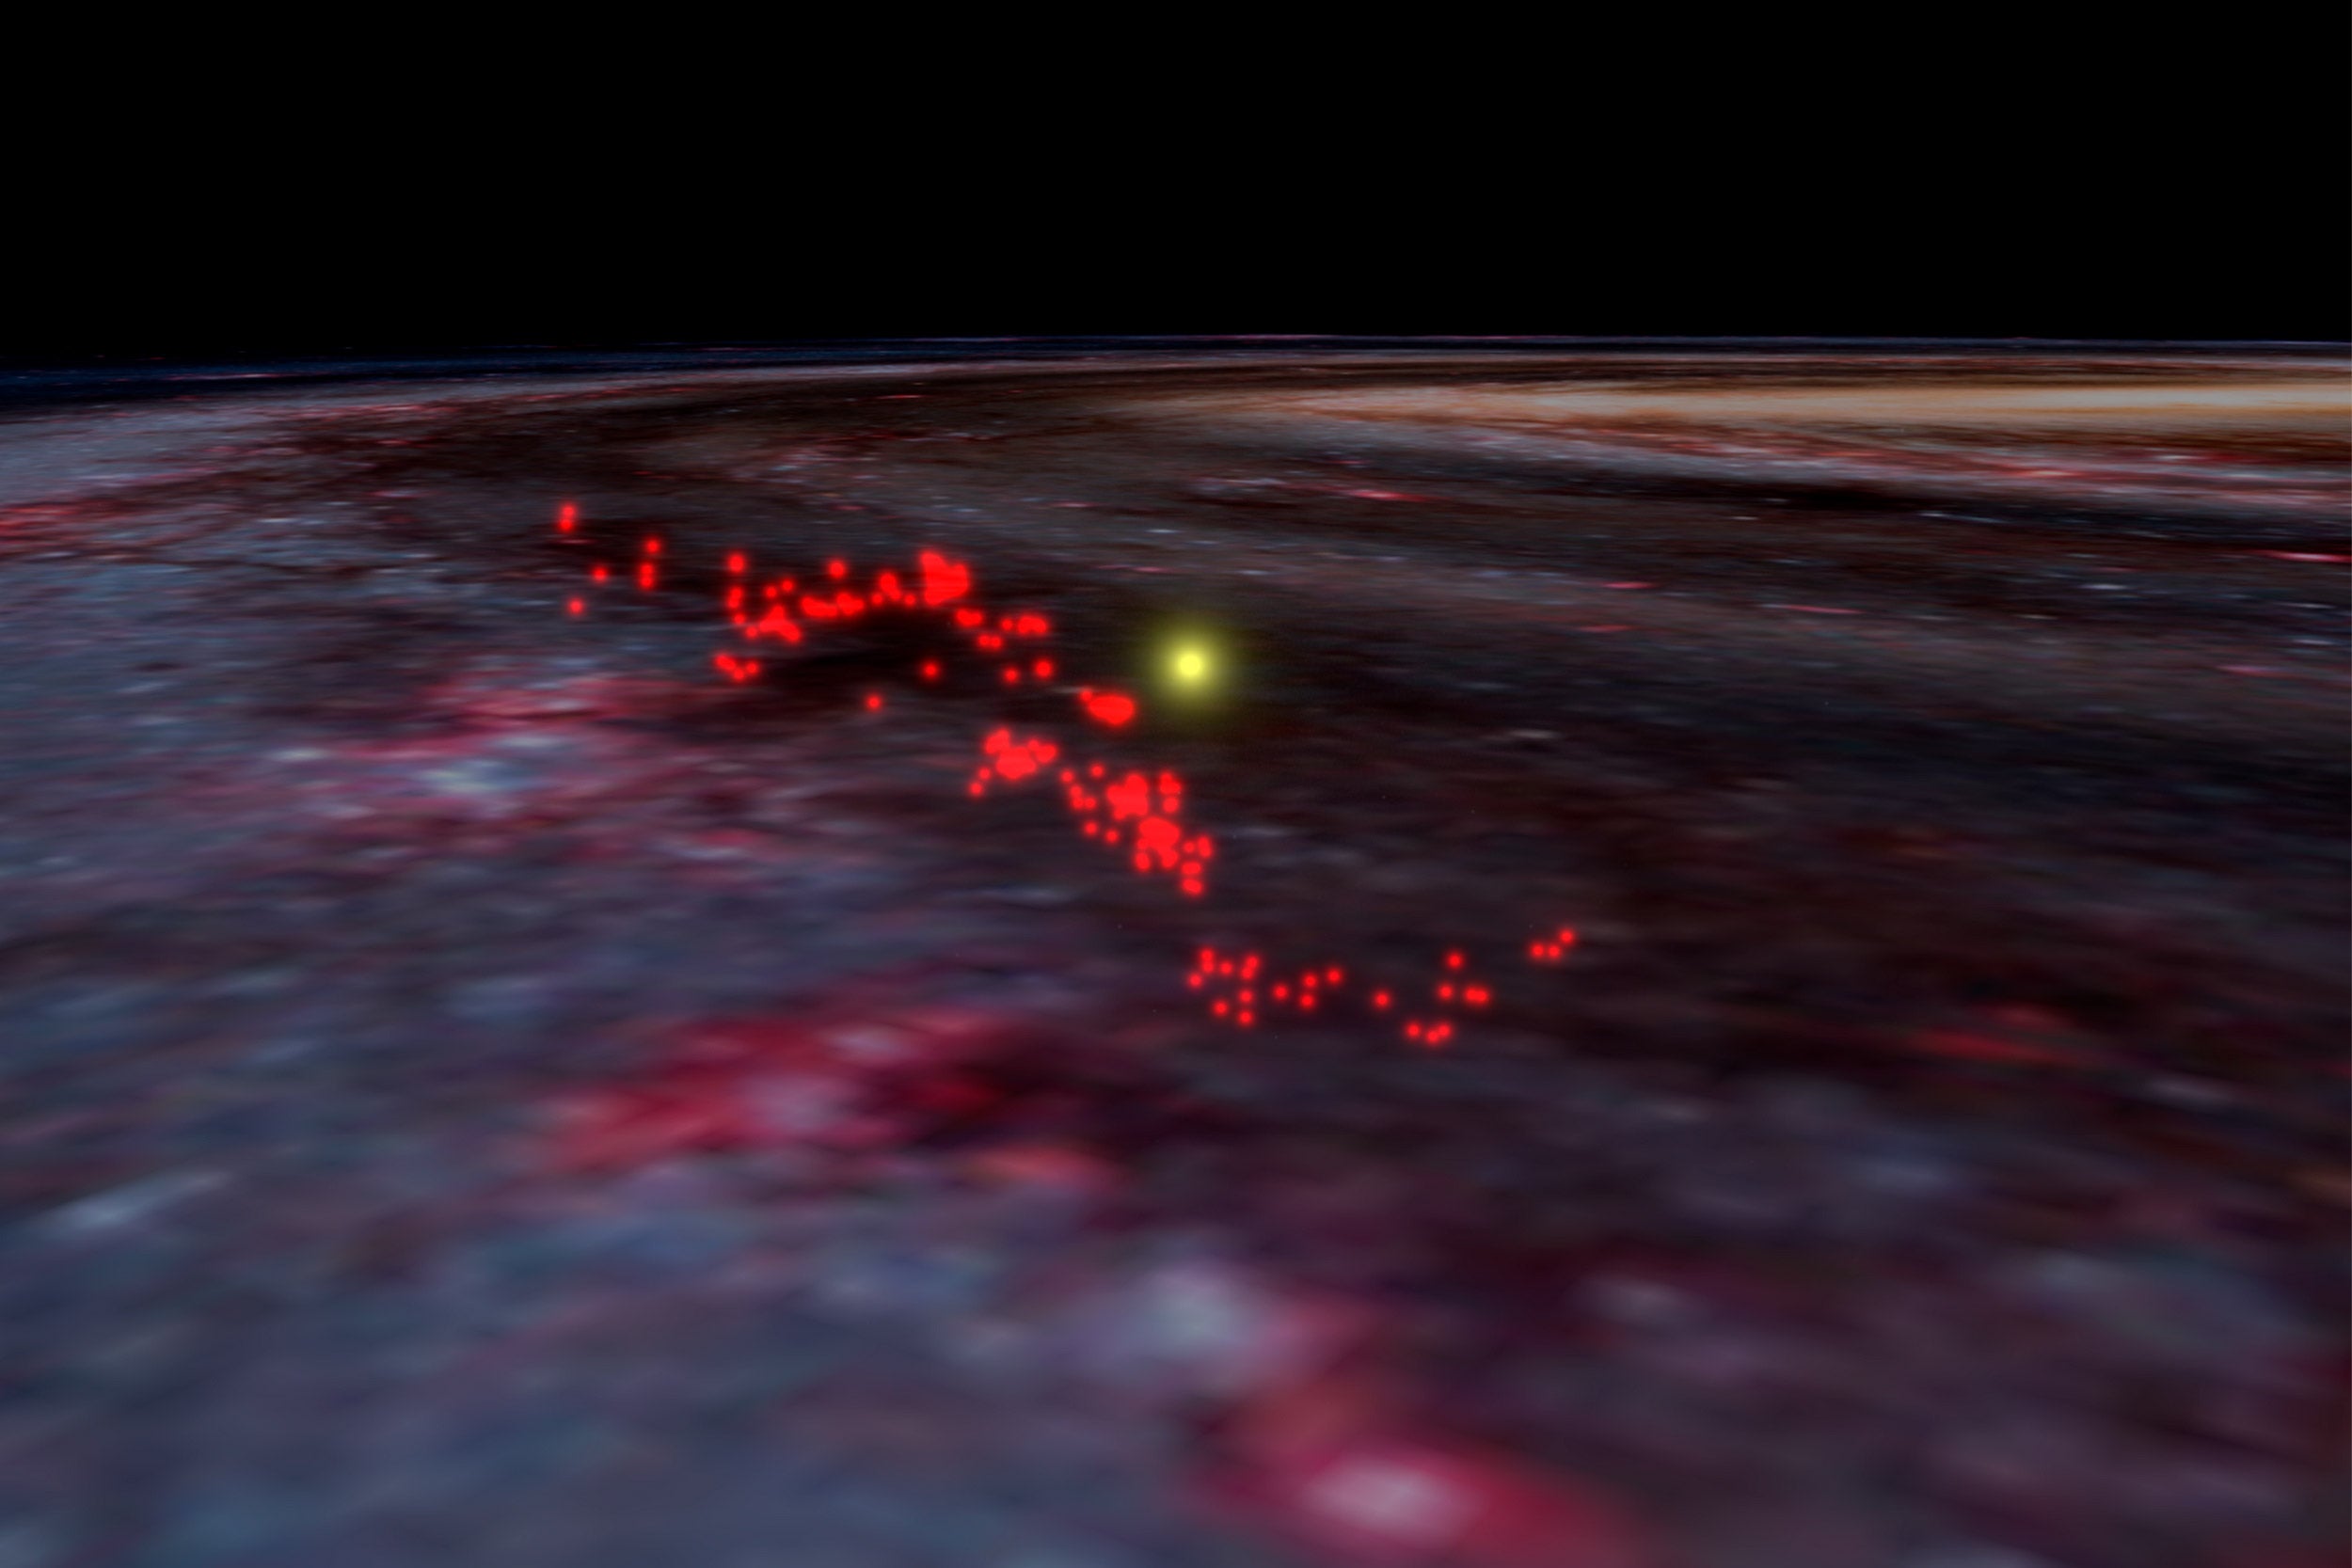
In this illustration, the “Radcliffe Wave” data is overlaid on an image of the Milky Way galaxy.
Image from the WorldWide Telescope, courtesy of Alyssa Goodman
Interconnected stellar nurseries form the largest gaseous structure ever observed in the Milky Way galaxy
Astronomers at Harvard University have discovered a monolithic, wave-shaped gaseous structure — the largest ever seen in our galaxy — made up of interconnected stellar nurseries. Dubbed the “Radcliffe Wave” in honor of the collaboration’s home base, the Radcliffe Institute for Advanced Study, the discovery transforms a 150-year-old vision of nearby stellar nurseries as an expanding ring into one featuring an undulating, star-forming filament that reaches trillions of miles above and below the galactic disk.
The work, published in Nature, was enabled by a new analysis of data from the European Space Agency’s Gaia spacecraft, launched in 2013 with the mission of precisely measuring the position, distance, and motion of the stars. The research team’s innovative approach combined the super-accurate data from Gaia with other measurements to construct a detailed, 3D map of interstellar matter in the Milky Way, and noticed an unexpected pattern in the spiral arm closest to Earth.
The researchers discovered a long, thin structure, about 9,000 light-years long and 400 light-years wide, with a wave-like shape, cresting 500 light-years above and below the mid-plane of our galaxy’s disk. The Wave includes many of the stellar nurseries that were thought to form part of “Gould’s Belt,” a band of star-forming regions believed to be oriented in a ring around the sun.
“No astronomer expected that we live next to a giant, wave-like collection of gas — or that it forms the local arm of the Milky Way,” said Alyssa Goodman, the Robert Wheeler Willson Professor of Applied Astronomy, research associate at the Smithsonian Institution, and co-director of the Science Program at the Radcliffe Institute for Advanced Study. “We were completely shocked when we first realized how long and straight the Radcliffe Wave is, looking down on it from above in 3D — but how sinusoidal it is when viewed from Earth. The Wave’s very existence is forcing us to rethink our understanding of the Milky Way’s 3D structure.”
“Gould and Herschel both observed bright stars forming in an arc projected on the sky, so for a long time, people have been trying to figure out if these molecular clouds actually form a ring in 3D,” said João Alves, a professor of physics and astronomy at the University of Vienna and 2018‒2019 Radcliffe Fellow. “Instead, what we’ve observed is the largest coherent gas structure we know of in the galaxy, organized not in a ring but in a massive, undulating filament. The sun lies only 500 light-years from the Wave at its closest point. It’s been right in front of our eyes all the time, but we couldn’t see it until now.”
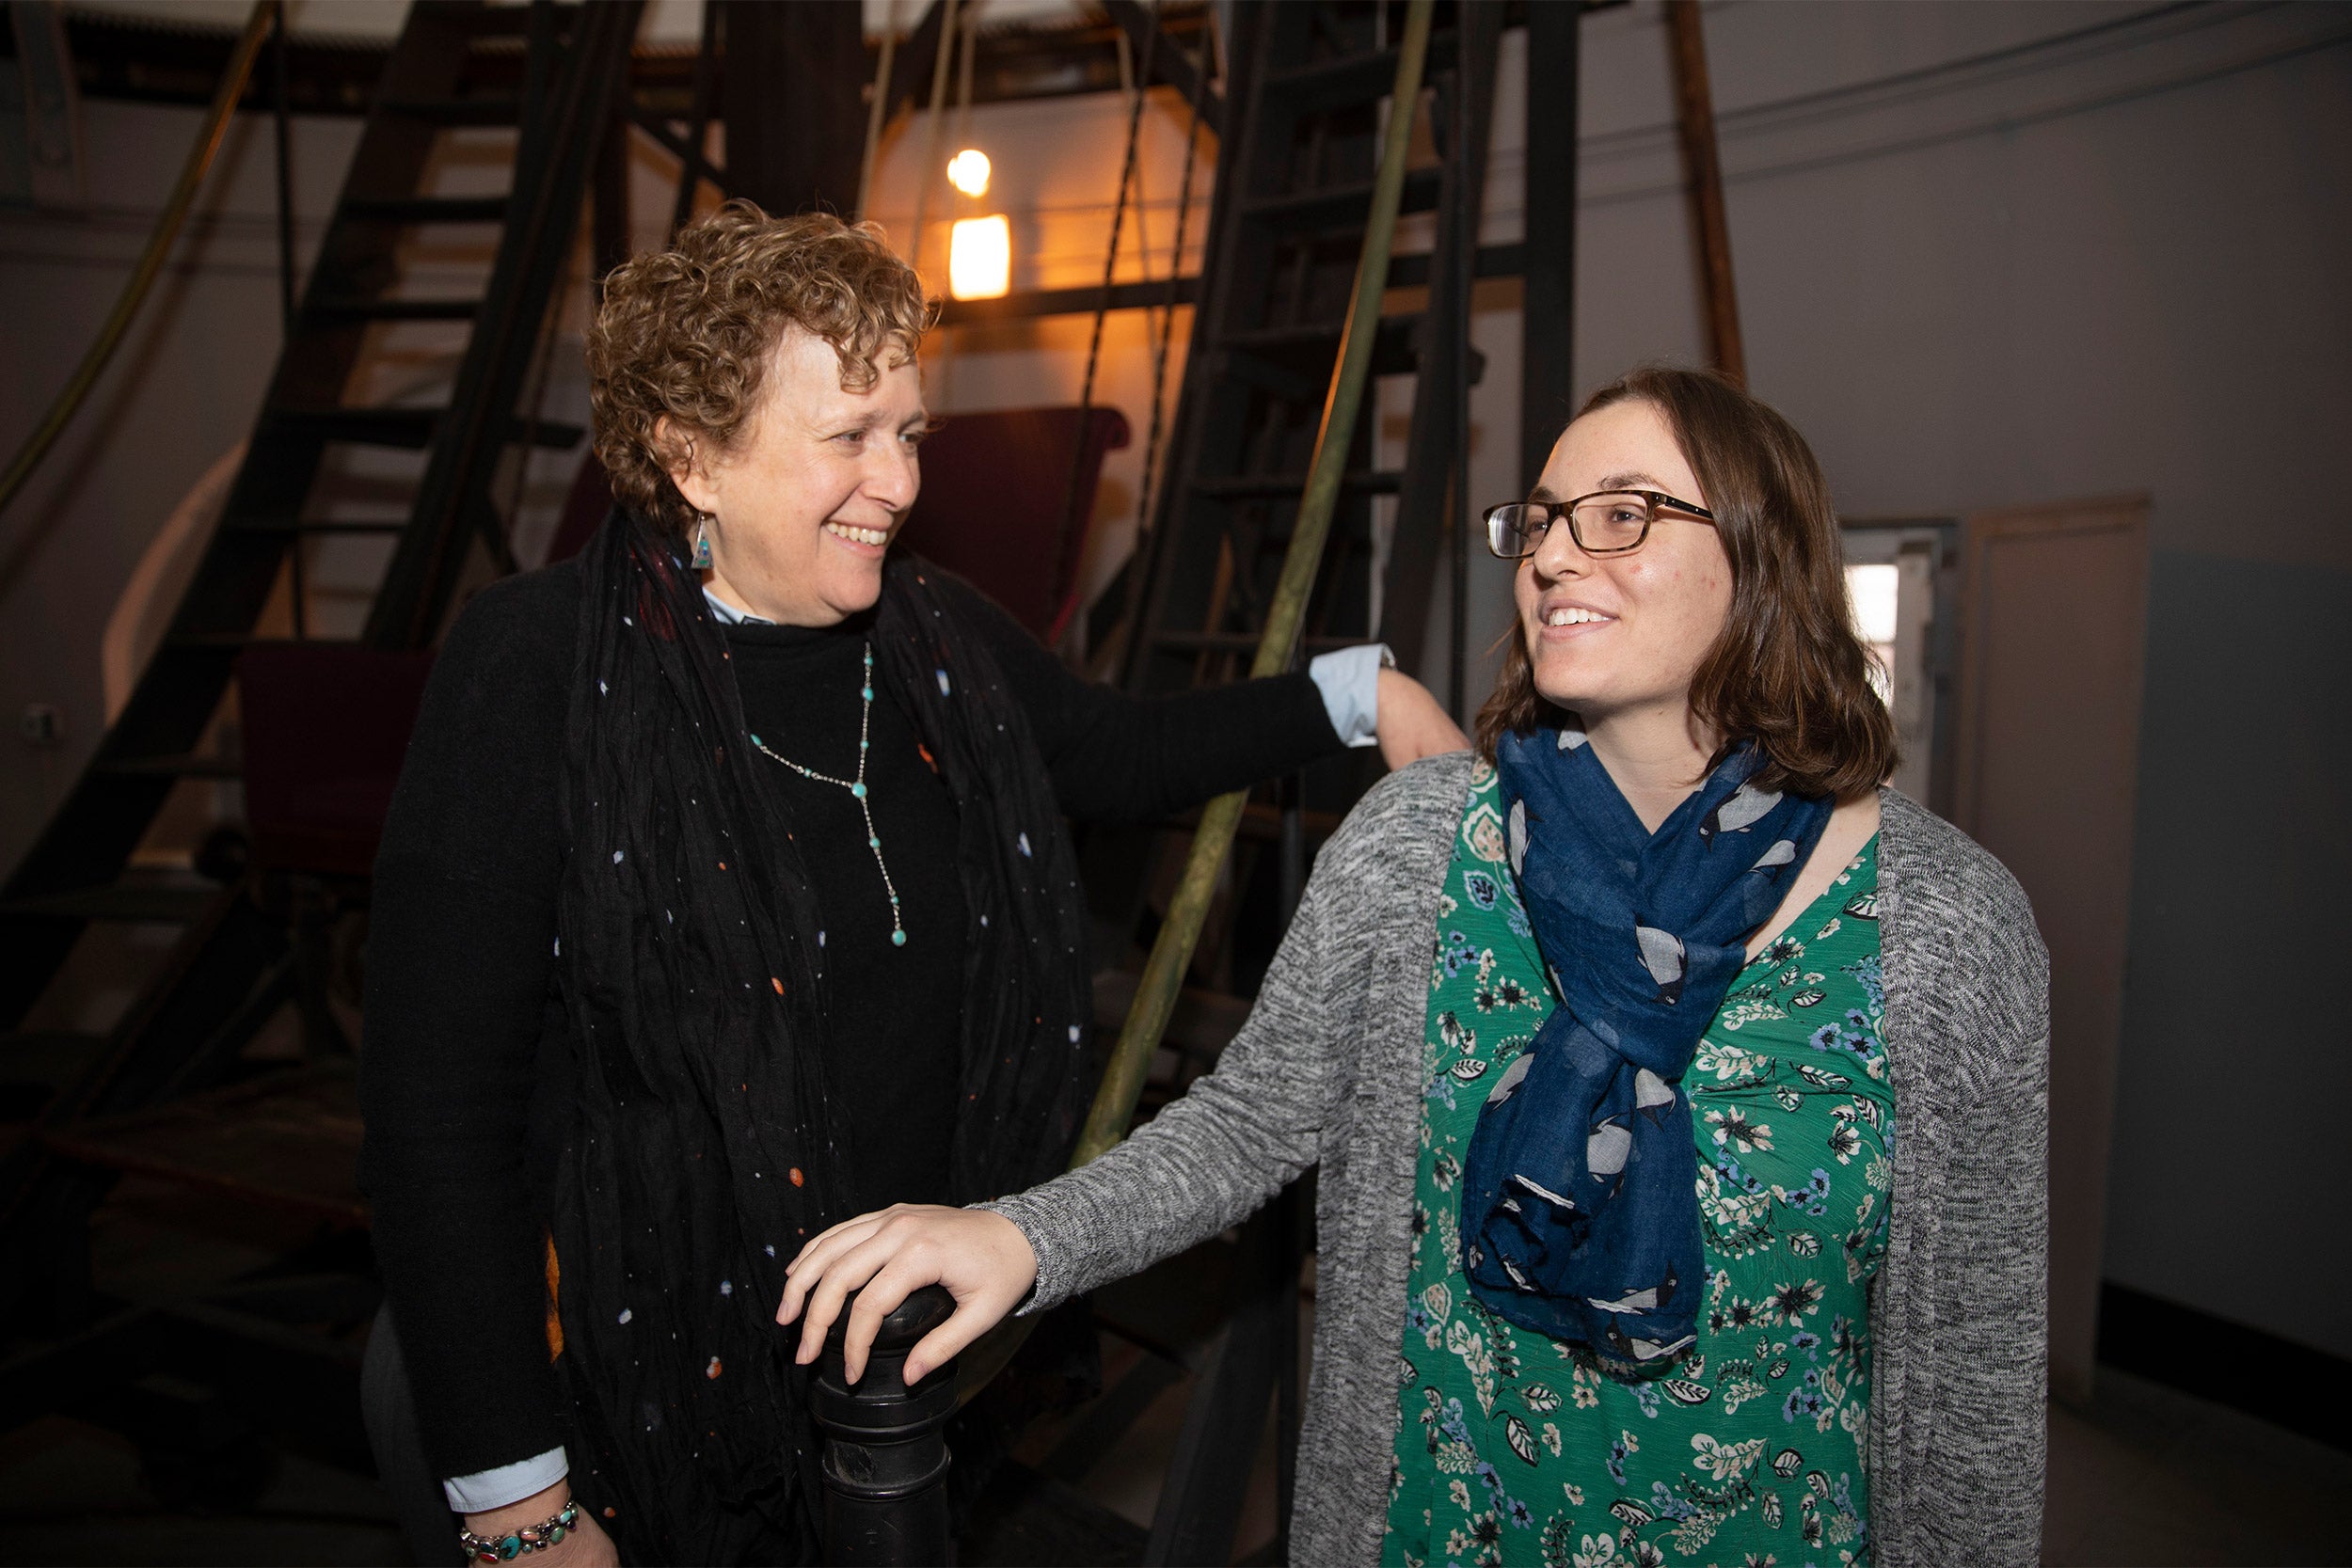
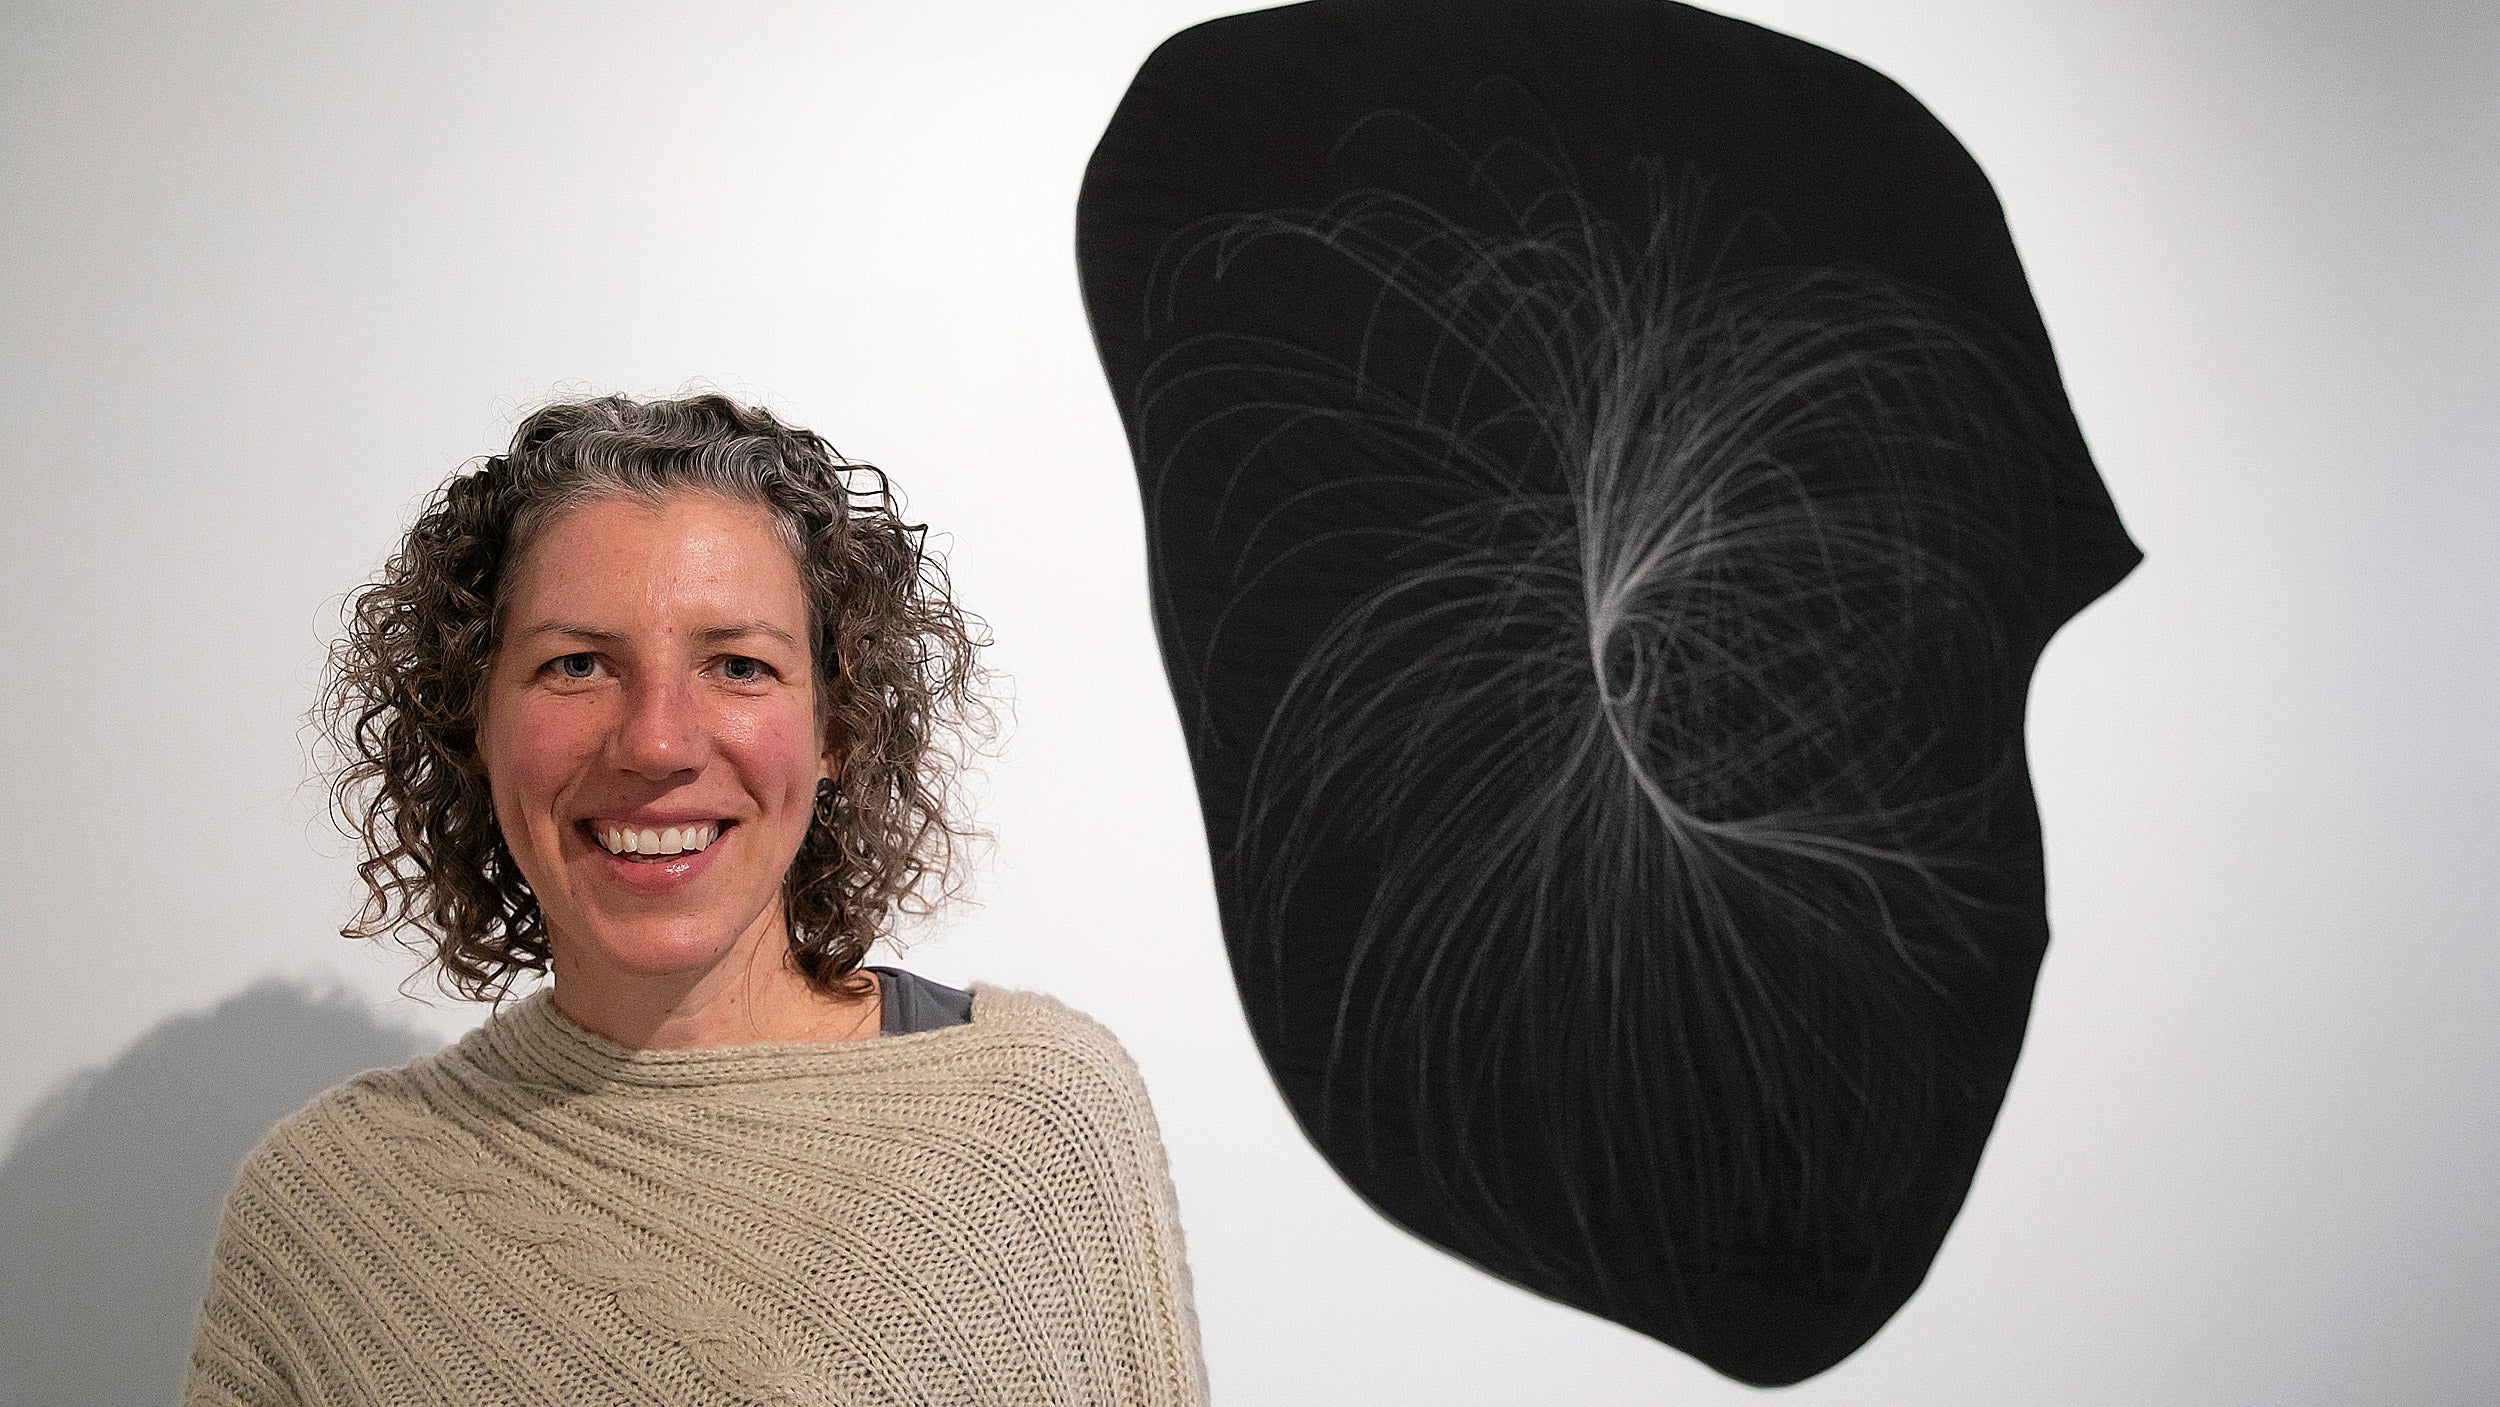
“No astronomer expected that we live next to a giant, wave-like collection of gas — or that it forms the local arm of the Milky Way,” said Harvard Professor Alyssa Goodman (left), standing with graduate student Catherine Zucker, a key member of the team.
Kris Snibbe/Harvard Staff Photographer
The new, 3D map shows our galactic neighborhood in a new light, giving researchers a revised view of the Milky Way and opening the door to other major discoveries.
“We don’t know what causes this shape, but it could be like a ripple in a pond, as if something extraordinarily massive landed in our galaxy,” said Alves. “What we do know is that our sun interacts with this structure. It passed by a festival of supernovae as it crossed Orion 13 million years ago, and in another 13 million years it will cross the structure again, sort of like we are ‘surfing the wave.’”
Disentangling structures in the “dusty” galactic neighborhood within which we sit is a longstanding challenge in astronomy. In earlier studies, the research group of Douglas Finkbeiner, professor of astronomy and physics at Harvard, pioneered advanced statistical techniques to map the 3D distribution of dust using vast surveys of stars’ colors. Armed with new data from Gaia, Harvard graduate students Catherine Zucker and Joshua Speagle recently augmented these techniques, dramatically improving astronomers’ ability to measure distances to star-forming regions. That work, led by Zucker, is published in the Astrophysical Journal.
“We suspected there might be larger structures that we just couldn’t put in context. So, to create an accurate map of our solar neighborhood, we combined observations from space telescopes like Gaia with astrostatistics, data visualization, and numerical simulations,” explained Zucker, a National Science Foundation graduate fellow and a Ph.D. candidate in the Department of Astronomy at Harvard’s Graduate School of Arts and Sciences.
“The sun lies only 500 light-years from the Wave at its closest point. It’s been right in front of our eyes all the time, but we couldn’t see it until now.”
João Alves, Radcliffe Fellow 2018-19
Zucker played a key role in compiling the largest-ever catalog of accurate distances to local stellar nurseries — the basis for the 3D map used in the study. She has set herself the goal of painting a new picture of the Milky Way, near and far.
“We pulled this team together so we could go beyond processing and tabulating the data to actively visualizing it — not just for ourselves but for everyone. Now, we can literally see the Milky Way with new eyes,” she said.
“Studying stellar births is complicated by imperfect data. We risk getting the details wrong, because if you’re confused about distance, you’re confused about size,” said Finkbeiner.
Goodman agreed, “All of the stars in the universe, including our sun, are formed in dynamic, collapsing, clouds of gas and dust. But determining how much mass the clouds have, how large they are, has been difficult, because these properties depend on how far away the cloud is.”
According to Goodman, scientists have been studying dense clouds of gas and dust between the stars for more than 100 years, zooming in on these regions with ever-higher resolution. Before Gaia, there was no data set expansive enough to reveal the galaxy’s structure on large scales. Since its launch in 2013, the space observatory has enabled measurements of the distances to one billion stars in the Milky Way.
The flood of data from Gaia served as the perfect testbed for innovative, new statistical methods that reveal the shape of local stellar nurseries and their connection to the Milky Way’s galactic structure. Alves came to Radcliffe to work with Zucker and Goodman, as they anticipated the flood of data from Gaia would enhance the Finkbeiner group’s “3D Dust Mapping” technology enough to reveal the distances of local stellar nurseries. But they had no idea they would find the Radcliffe Wave.
The Finkbeiner, Alves, and Goodman groups collaborated closely on this data-science effort. The Finkbeiner group developed the statistical framework needed to infer the 3D distribution of the dust clouds; the Alves group contributed deep expertise on stars, star formation, and Gaia; and the Goodman group developed the 3D visualizations and analytic framework, called “glue,” that allowed the Radcliffe Wave to be seen, explored, and quantitatively described.
The articles, analyzed data (on the Harvard Dataverse), statistical code, interactive figures, videos, and WorldWide Telescope tour are all freely available to everyone through a dedicated website.
This study was supported by the NSF Graduate Research Fellowship Program (grant no. 1650114, AST-1614941), the Harvard Data Science Initiative, NASA through ADAP (grant no. NNH17AE75I), and a Hubble Fellowship (grant HST-HF2-51367.001-A) awarded by the Space Telescope Science Institute, which is operated by the Association of Universities for Research in Astronomy, Inc., for NASA, under contract NAS 5-26555.