James Robins makes statistics tell the truth
Numbers in the service of health
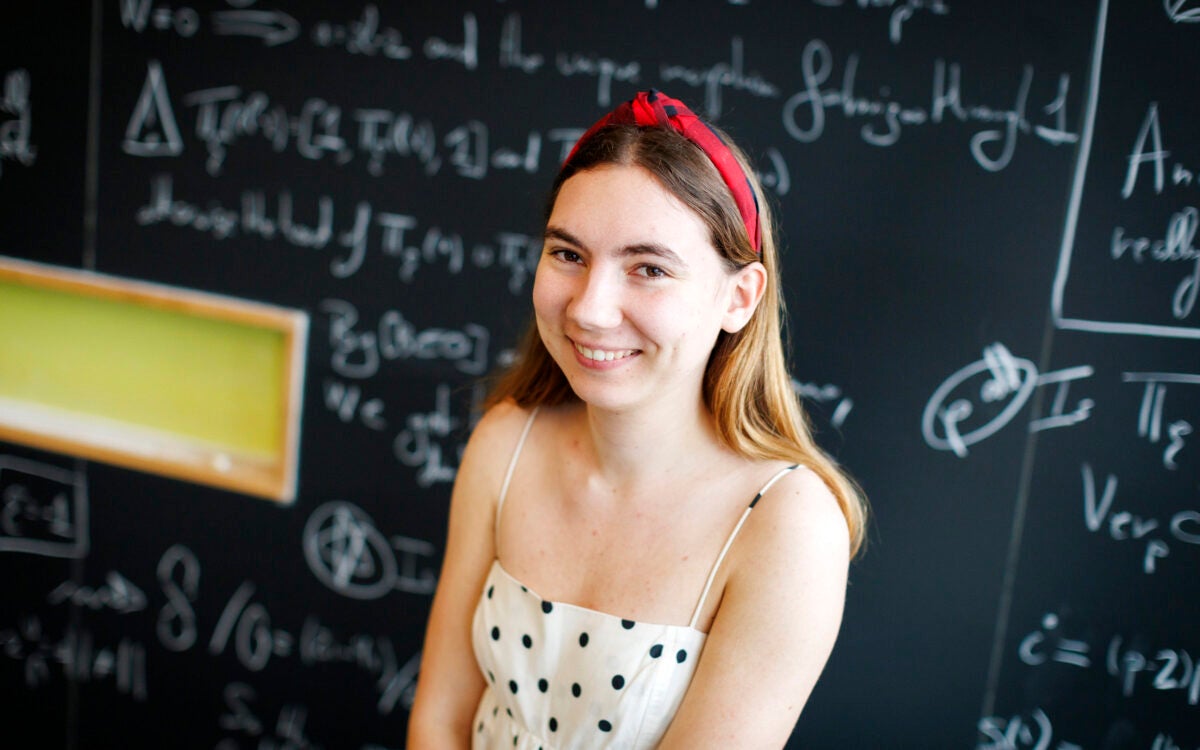
The white board that covers hundreds of feet of the curved hallway at the Institute for Quantitative Social Science (IQSS) is not always covered with equations – but lately, it usually is. And most of them are in the haphazard hand of James M. Robins, an IQSS faculty associate and a professor of epidemiology and biostatistics at the Harvard School of Public Health. “I’m not the most organized person in the world,” says Robins, his chair rolling over a splash of papers that spill out of his briefcase and onto the floor of his office. “So the equations usually sit there for awhile before I type them into my computer.”
It seems a metaphor for the path he has taken in life – circuitous but ultimately inevitable. It began when Robins, then a junior resident at an occupational-health clinic he and a friend had started at the Yale-New Haven Medical Center, started learning about statistics while researching workers’ compensation cases.
Having taken “more abstract stuff” as a Harvard undergrad, he says, “I didn’t know what this stuff was.” He took some statistics courses but was mostly self-taught, applying Baysian statistics to epidemiological concepts and learning the foundations and principles of statistical inference along the way.
“Epidemiology is a very strange field,” he says. “Almost every textbook was called ‘Intro to …’ because no one understood what to do about data on real exposures that vary over time.” For example, workers with the highest exposure to a particular harmful chemical should have more of a particular disease; but real-world “confounders” skew study results. For example, people who start to get sick are likely to leave work and get less exposure – but it’s hard to determine who leaves because of illness and who leaves for other reasons.
“It’s a very hard problem,” Robins says. “And basically, I spent the next 20 years thinking about it. I figured out a statistical trick that can turn the observational data we have into data we would have seen if we had done the study randomly.” This creates a new data set in which some patients are copied more than once, depending on their probability of getting the treatment they actually did get based on doctors’ patterns. This creates a “pseudo-population” that is essentially the same as a randomized cohort.
This is not the only statistical innovation Robins has come up with over the years, but, he says, “it’s [the] easiest to explain, believe me.”
The model has caught on in statistical circles as high as the FDA – and Robins has “gone off in a completely new direction” that is so complicated he presumes it will occupy him for the rest of his life.


